Biglycan ELISA: Technical Overview, Assay Design and Research Applications

Biglycan is a small leucine-rich proteoglycan (SLRP) of the extracellular matrix (ECM) encoded by the BGN gene on the X chromosome. According to NCBI Gene records, human biglycan is a secreted matrix component involved in collagen fibrillogenesis, bone growth, muscle development, and innate immune signaling via pattern-recognition receptors such as TLR2 and TLR4 GenBank+1. These properties make Biglycan ELISA a valuable research tool for quantifying biglycan protein levels in serum, plasma, cell culture supernatant, tissue extracts and other biological samples in ECM biology, inflammation, and biomarker discovery studies.

This article provides a technical, SEO-optimized description of Biglycan ELISA, including molecular background, assay principle, sample handling, analytical performance and optimization strategies, with emphasis on research-use-only applications.

Molecular Background of Biglycan (BGN)

The human BGN gene is documented in detail in the NCBI Gene: BGN (Homo sapiens) entry, which describes biglycan as an ECM proteoglycan with a core protein decorated by chondroitin sulfate or dermatan sulfate chains GenBank. Orthologous entries exist for mouse Bgn, rat Bgn and other species, facilitating translational comparisons in preclinical models GenBank+1.

Biglycan belongs to the small leucine-rich proteoglycan family, extensively reviewed in the context of ECM biology and the “matrisome” in resources such as the ECM overview from the MIT extracellular matrix guide and the Virginia Tech “Extracellular Matrix” cell biology textbook dspace.mit.edu+1. These references highlight proteoglycans as core ECM structural and signaling elements.

Detailed structural descriptions of proteoglycans and glycosaminoglycans (GAGs) are available from university sources such as the RPI “Proteoglycan sequence” document, the Caltech “glycosaminoglycan code” review and a recent overview of proteoglycans in mechanobiology from UTHealth/TMC Digital Commons dspace.rpi.edu+2HSIEH-WILSON LAB+2. These resources explain how the bottle-brush architecture of proteoglycans, including biglycan, influences hydration, tissue mechanics and cell signaling.

Comprehensive reviews, such as “Biglycan: a multivalent proteoglycan providing structure and signals” in the Journal of Histochemistry & Cytochemistry and related articles accessible via PubMed and PMC, discuss biglycan’s dual structural and signaling functions in musculoskeletal tissues and immunity PubMed+1. Additional NIH-hosted articles describe biglycan as a danger-associated molecular pattern (DAMP) that engages TLR2/4 and promotes sterile inflammation, as summarized in “The matrix component biglycan is proinflammatory and signals through TLR4 and TLR2” PMC and in broader reviews on proteoglycan signaling such as “Biological interplay between proteoglycans and their receptors” PMC.

These curated .gov and .edu resources provide the molecular and functional context that underpins the development of Biglycan ELISA assays.

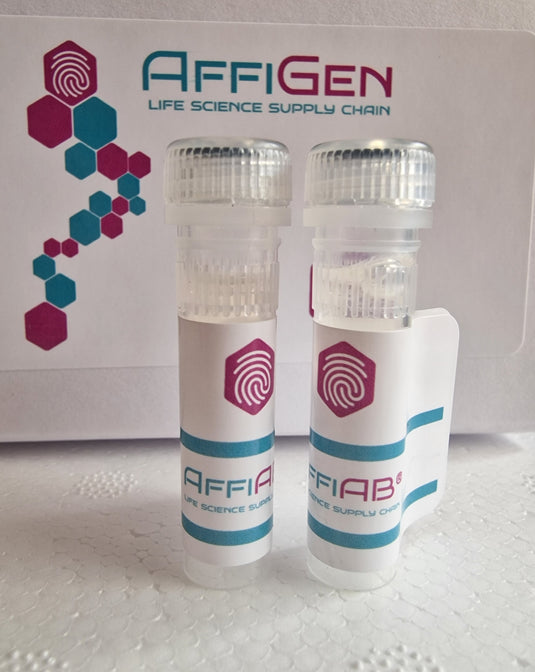
AffiELISA® Rat Biglycan ELISA [ Bgn]

Principle of Biglycan ELISA

Biglycan ELISA is typically configured as a quantitative sandwich ELISA. The general ELISA principle is extensively described in academic resources, for example:

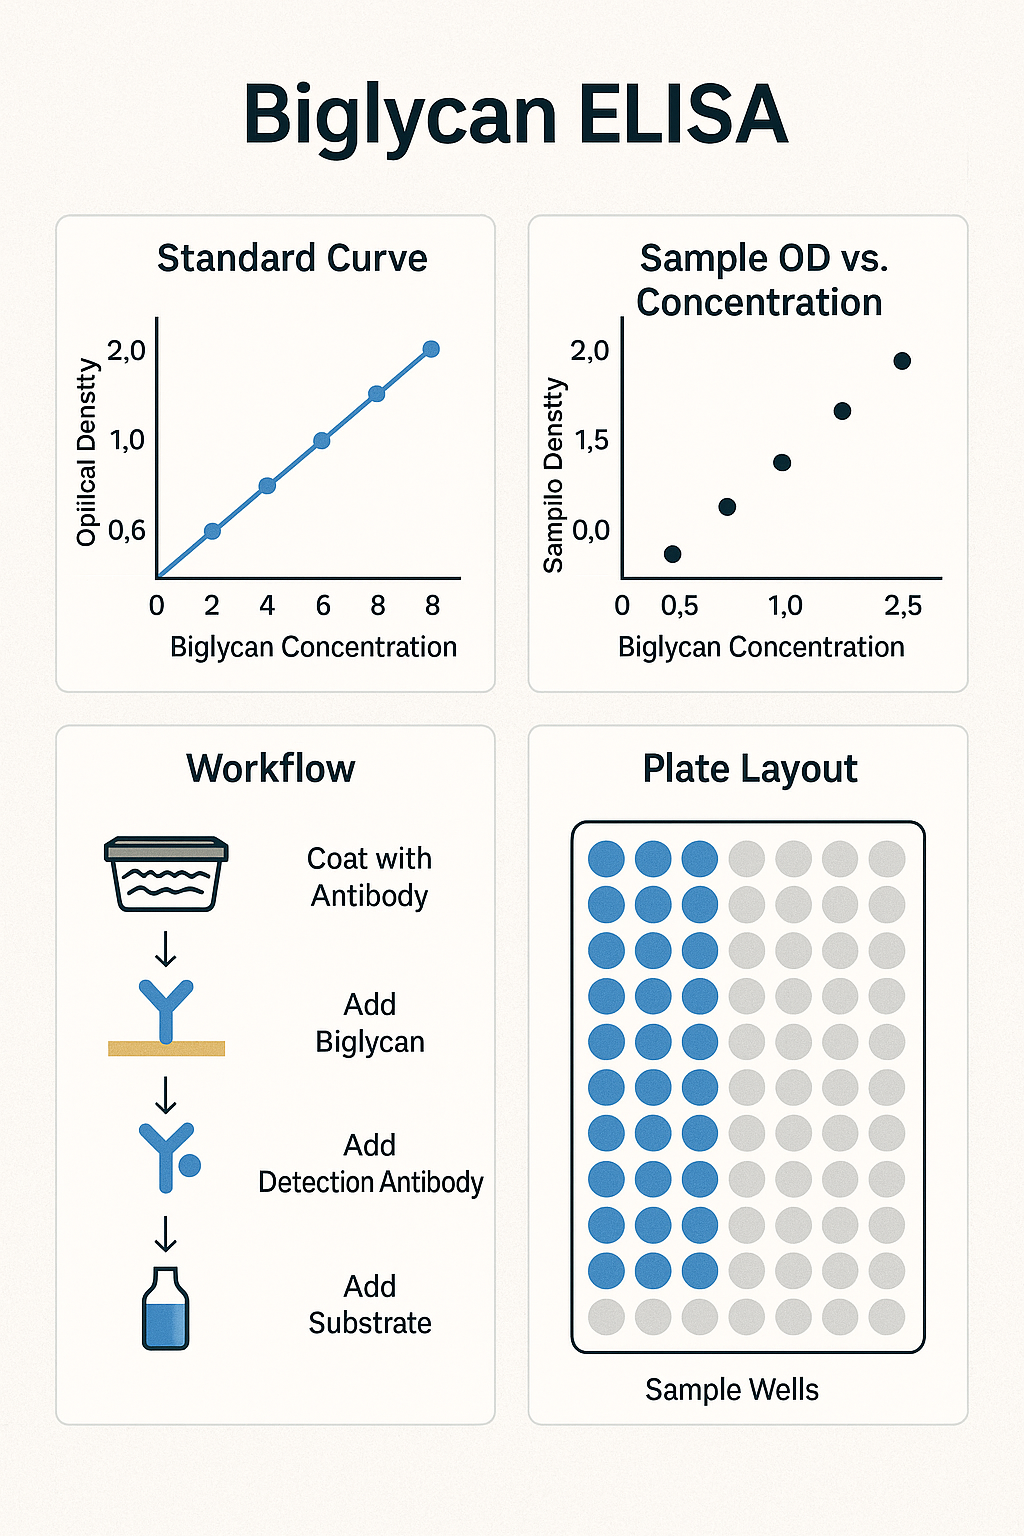
In a Biglycan ELISA kit, the typical steps are:

  1. Coated capture antibody specific for human biglycan is immobilized on a microplate.

  2. Sample or biglycan standards are added; biglycan binds to the capture antibody.

  3. A biotinylated or enzyme-conjugated detection antibody recognizing a different epitope binds the captured biglycan, forming a capture–antigen–detection “sandwich”.

  4. An enzyme conjugate (e.g., streptavidin-HRP) is added if required by the format.

  5. A chromogenic substrate (e.g., TMB) is converted to a colored product; absorbance is measured at 450 nm (with reference at 620–630 nm).

  6. A standard curve generated from known concentrations of recombinant biglycan allows quantification in unknown samples by fitting a four-parameter logistic (4-PL) or similar model.

Advanced immunoassay platforms, such as the single-molecule colocalization ELISA described by the Soh Lab at Stanford (PDF hosted on stanford.edu), demonstrate how sophisticated detection strategies can push ELISA sensitivity while still relying on the same fundamental immunochemical principles Soh Lab+1.

Sample Types and Pre-analytical Considerations

Biglycan ELISA kits are generally validated for serum, plasma (EDTA, heparin, citrate), cell culture supernatants, and tissue or ECM extracts. Pre-analytical handling should follow good laboratory practices derived from generic immunoassay method development, such as those described in the dried blood spot ELISA validation study from the University of Michigan Deep Blue repository Deep Blue.

Key points include:

  • Avoid repeated freeze–thaw cycles that can fragment proteoglycans or cleave GAG chains.

  • Use protease inhibitors during tissue or ECM extraction when studying biglycan protein levels or neo-epitopes.

  • Standardize dilution factors to bring biglycan concentration into the dynamic range of the ELISA.

  • Record collection conditions (time, anticoagulant, storage) to minimize matrix-related variability.

Because biglycan is an ECM molecule, its representation in biological fluids may depend on shedding, secretion, degradation and complex formation with collagen or other matrix components, as discussed in ECM reviews from Monash University cardiovascular ECM research and matrisome analyses hosted at MIT research.monash.edu+1. For this reason, researchers often evaluate more than one sample matrix (e.g., serum vs. conditioned medium) during assay validation.
Calibration Curve and Analytical Performance

For a high-quality Biglycan ELISA kit, key analytical parameters include:

  • Sensitivity (limit of detection, LOD) in the low pg/mL to low ng/mL range

  • Dynamic range typically spanning 2–3 orders of magnitude

  • Intra-assay and inter-assay CV usually <10–15%

  • Spike-and-recovery within ~80–120% in multiple matrices

  • Parallelism between endogenous samples and recombinant standard curve

Quantitative ELISA modeling frequently uses Langmuir-type isotherms or logistic models. A Stanford-hosted immunoassay methods paper points out that classical ELISA data are often fit using two parameters (KD and Bmax) or 4-PL logistic equations to describe binding and saturation behavior in calibration curves Soh Lab.

During Biglycan ELISA method development, researchers are encouraged to follow general immunoassay optimization strategies found in academic references such as:

These documents provide generalizable concepts like blocking optimization, surface chemistry, incubation kinetics, and background reduction, which can be translated directly to Biglycan ELISA optimization.

Research Applications of Biglycan ELISA

Because biglycan is a central ECM proteoglycan, Biglycan ELISA is widely applicable in preclinical research fields such as:

  1. Musculoskeletal biology and bone remodeling

    • Reviews on biglycan’s structure-function in bone and cartilage from PubMed/NIH summarize evidence that biglycan contributes to bone mass, osteoblast and osteocyte function, and age-related ECM changes PubMed.

    • Mouse models with biglycan deletion show altered bone mineralization and growth, described in mouse Bgn NCBI Gene GenBank. Biglycan ELISA can quantify circulating or tissue-derived biglycan in such models.

  2. Cardiovascular and connective tissue research

    • ECM composition in the cardiovascular system is discussed in detail in the Monash cardiovascular ECM review, which highlights proteoglycans in vascular remodeling and stiffness research.monash.edu.

    • Biglycan levels measured by ELISA in experimental models may correlate with ECM remodeling, fibrosis, or vascular calcification in basic research (without implying any diagnostic claim).

  3. Inflammation and innate immunity

    • Biglycan acts as a DAMP and engages TLR2/4, as shown in an NIH-hosted article on the pro-inflammatory role of biglycan PMC.

    • Quantitative Biglycan ELISA in cell culture supernatants or animal plasma enables researchers to monitor biglycan release during sterile inflammation and to evaluate interventions that modulate ECM-derived signaling.

  4. Oncology and tumor microenvironment

    • A research article on the extracellular SLRP biglycan in gastric cancer indicates that biglycan expression modulates cell survival, migration and angiogenic features in cancer models PMC.

    • In oncology research, Biglycan ELISA can be used to study ECM remodeling, tumor–stroma interaction and cancer-associated fibroblast activity at the protein level, strictly as a research biomarker.

  5. Neuromuscular and synaptic biology

Across these domains, Biglycan ELISA is a research-use-only tool that supports mechanistic studies of ECM biology, without serving as a stand-alone diagnostic assay.

Assay Optimization and Troubleshooting

To obtain robust, reproducible biglycan measurements, standard ELISA optimization practices derived from university protocols should be applied:

  • Coating concentration and buffer: Adjust capture antibody concentration and coating buffer (e.g., carbonate vs. PBS) to maximize specific signal and minimize background, as illustrated in ELISA development examples from UMich and Harvard fanlab.bme.umich.edu+1.

  • Blocking reagent: Compare BSA, casein, or specialized blocking buffers to suppress nonspecific adsorption on plastic surfaces.

  • Sample dilution: For complex matrices (serum, plasma), empirical dilution series can reduce matrix interference while keeping biglycan within the standard curve.

  • Incubation time and temperature: Optimize to reach near-equilibrium binding, balancing sensitivity and throughput.

  • Wash stringency: Adjust wash buffer composition (Tween-20 concentration, ionic strength) and wash cycles to reduce background.

More advanced strategies, such as single-molecule colocalization and microfluidic formats described in Stanford and Harvard ELISA method papers, can inspire enhancements in sensitivity and miniaturization for Biglycan ELISA while preserving standard sandwich assay architecture Soh Lab+1.

Positioning Biglycan ELISA Among ECM Biomarker Assays

In the broader context of ECM proteoglycan assays, Biglycan ELISA complements measurements of other SLRPs (decorin, lumican, versican) and collagens. Reviews available on PubMed Central and NCBI Bookshelf outline how ECM proteins form interconnected networks that impact tissue mechanics, growth factor bioavailability and cell adhesion PMC+1.

By integrating Biglycan ELISA data with:

  • gene expression profiles (e.g., NCBI Gene),

  • proteomic matrisome signatures (as summarized in MIT matrisome literature),

  • and functional assays of cell behavior (migration, adhesion, mechanotransduction),

researchers can construct multi-omic views of ECM remodeling in development, injury and disease models.

SEO-Relevant Keywords for Biglycan ELISA Content

To enhance search engine visibility for Biglycan ELISA product pages and scientific blog articles, the following technical keywords can be naturally integrated into the text (as done above):

  • Biglycan ELISA, human Biglycan ELISA kit, BGN ELISA, extracellular matrix biomarker assay

  • small leucine-rich proteoglycan, SLRP proteoglycan, biglycan DAMP, biglycan TLR2 TLR4 ligand

  • quantitative sandwich ELISA, colorimetric ELISA kit, serum and plasma biglycan, sample dilution, 4-parameter logistic standard curve

  • intra-assay CV, inter-assay CV, linearity, spike-and-recovery, limit of detection (LOD)

  • ECM remodeling assay, bone matrix biomarker, fibrosis research, cardiovascular ECM, tumor microenvironment biomarker

Using these high-relevance technical terms together with authoritative .edu and .gov hyperlinks like NCBI Gene, PubMed/PMC, and university ELISA method pages strengthens SEO indexing while keeping the content focused on research, method development and basic science, and avoiding clinical or therapeutic claims.
Anti-mRaspberry Polyclonal IgG Antibody: High-Sensitivity Detection of mFruit-Family Red Fluorescent Proteins

Background on mRaspberry and red fluorescent proteins

mRaspberry is a monomeric red fluorescent protein (RFP) engineered from DsRed (Discosoma sp.) as part of the mFruit series (mCherry, mStrawberry, mPlum, etc.). These derivatives were developed to provide a broad spectral palette of monomeric fluorescent proteins optimized for live-cell imaging, protein tagging, and multicolor microscopy.

The classical mFruit engineering work and FP selection principles are summarized in Shaner et al., “Choosing fluorescent proteins,” from the Tsien lab at the University of California San Diego (UCSD PDF) and in a detailed fluorescent protein user guide from Albert Einstein College of Medicine (Einstein FP guide). tsienlab.ucsd.edu+1

Spectral properties of mRaspberry and related RFPs (excitation ~598 nm, emission ~625 nm) are tabulated in overviews of red and far-red fluorescent proteins from Zeiss / Wake Forest University (Fluorescent proteins – Zeiss campus PDF) and in Wiedenmann et al.’s review on fluorescent proteins for live-cell imaging at Texas A&M University (chem.tamu.edu FP review). microscopy.wfu.edu+1

A more specialized analysis of far-red variants, including mRaspberry, mPlum and E2-Crimson, is available from NCBI PMC and the University of Chicago (e.g. Lin & Tsien, “Autofluorescent proteins with excitation in the optical window,” NIH/NCBI PDF; Strack et al., “E2-Crimson,” UChicago PDF). tsienlab.ucsd.edu+1

These resources frame mRaspberry as a far-red, monomeric DsRed derivative with good compatibility for mammalian expression, deep-tissue imaging and multiplexing.

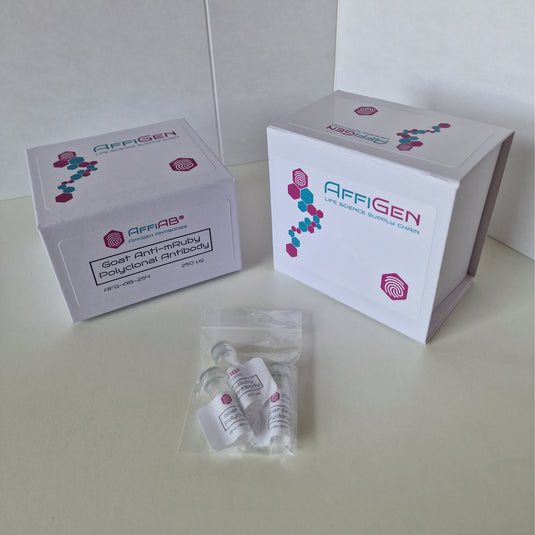
AffiAB® Goat Anti-mRuby Polyclonal Antibody

Concept and format of Anti-mRaspberry Polyclonal IgG Antibody

 Polyclonal IgG concept

An Anti-mRaspberry Polyclonal IgG Antibody is generated by immunizing a host species (commonly rabbit, goat or sheep) with purified recombinant mRaspberry protein or a fragment containing the structured β-barrel. The immune system produces a diverse polyclonal repertoire of IgG molecules recognizing multiple epitopes across the mRaspberry surface.

General overviews of polyclonal antibody production are provided by:

These documents describe antigen preparation, adjuvant selection, animal handling and bleed schedules used for high-titer, high-affinity polyclonal IgG production.

 Why antibody detection for fluorescent proteins?

Although mRaspberry is intrinsically fluorescent, there are important reasons to detect it with an antibody:

  1. Signal amplification – Indirect immunofluorescence with a primary anti-mRaspberry antibody and fluorophore-conjugated secondary antibody can increase the effective signal, which is essential when expression levels are low or when fixation quenches the chromophore. Practical IF amplification guidance is available from Duke University Microscopy Core (IF sample-prep guide) and the University of Nebraska–Lincoln (UNL IF protocol). microscopy.duke.edu+1

  2. Harsh fixation / antigen retrieval – Cross-linking fixatives and paraffin embedding can destroy FP fluorescence, but epitopes remain recognizable by antibody. Step-by-step paraffin IF protocols from NCBI / Max Planck and UAMS illustrate how antigen retrieval and permeabilization are combined with antibody detection (IF paraffin protocol, PMC; UAMS immunofluorescence immunotyping). PMC+1

  3. Multi-color multiplexing – Anti-mRaspberry can be combined with anti-GFP, anti-mCherry and anti-epitope-tag antibodies to map multiple tagged proteins simultaneously. Multiplex IF strategies are described in protocols from Northwestern University (Bevan lab IF protocol) and Johns Hopkins School of Medicine (multiplex IF chapter). labs.feinberg.northwestern.edu+1

Recent reviews from NCBI PMC highlight that antibodies and nanobodies against fluorescent proteins have become critical tools for super-resolution imaging, protein tracking and biochemical enrichment (e.g. Chen et al., “Research progresses and applications of fluorescent protein antibodies and nanobodies,” PubMed; Beghein & Gettemans, “Nanobody technology,” PMC). PubMed+1

Usage note: Anti-mRaspberry Polyclonal IgG Antibody is a research-use-only reagent and is not intended for diagnostic or therapeutic purposes.

Antigen design, epitope coverage and structural considerations

mRaspberry structure and antigenicity

Like other GFP-like proteins, mRaspberry adopts a β-barrel fold surrounding an internal chromophore. Structural depictions of GFP-like chromophores and β-barrels are illustrated in Wiedenmann et al. (Texas A&M FP review PDF) and in extended Stokes-shift analyses of the related mPlum protein at USC (mPlum Stokes shift analysis). Chemistry at Texas A&M University+1

Because the surface of the β-barrel contains multiple solvent-exposed loops, polyclonal antibodies typically recognize several independent epitopes, giving:

  • High apparent affinity (avidity)

  • Robust detection even if one epitope is masked by fusion partners or partial denaturation

  • Some cross-reactivity with closely related RFPs (mCherry, mStrawberry, etc.)

Spectral and structural tuning in far-red fluorescent proteins, including mRaspberry derivatives, is discussed in structure-guided wavelength-tuning work funded by the National Science Foundation (NSF PARN – Ng et al. PDF). NSF Public Access

Epitope mapping and cross-reactivity within the mFruit family

The mFruit family members share significant sequence identity in the β-barrel region. As a result:

  • Anti-mRaspberry polyclonal IgG often recognizes mRaspberry-tagged fusion proteins robustly.

  • Partial cross-reactivity with mCherry, mPlum, mStrawberry and similar derivatives may be observed; this can be either an advantage (generic anti-RFP antibody) or a limitation (if strict specificity is needed).

Reviews of fluorescent proteins as imaging toolkits from University of Washington (GFP/RFP review PDF) and Lin & Tsien’s “Optical window” paper at UCSD (autofluorescent proteins PDF) provide sequence and spectral comparisons across many RFP variants. Chemistry at Texas A&M University+1

If necessary, adsorption of the polyclonal serum against non-mRaspberry RFPs, or switching to a monoclonal antibody against a unique mRaspberry epitope, can reduce cross-reactivity.

Production and purification of Anti-mRaspberry Polyclonal IgG

 Immunization strategies

Standard rabbit polyclonal antibody schedules involve:

  • Initial immunization with 50–1000 µg of antigen emulsified in an adjuvant

  • Booster injections every 2–4 weeks

  • Test bleeds for titer evaluation 7–10 days after boosts

Technical details and example schedules:

Alternative methods such as cDNA immunization for polyclonal antibody production are described in open access at NCBI PMC (genetic immunization protocol, PMC), and can, in principle, be adapted for expressing mRaspberry in situ for immunization. PMC

 Purification of IgG and affinity enrichment

After terminal or partial bleeds, serum is processed to isolate:

  • Total IgG via Protein A / Protein G chromatography

  • Affinity-purified anti-mRaspberry IgG using immobilized mRaspberry on agarose

Optimization of affinity purification capacity and specificity is comparable to procedures used in other polyclonal antibody projects, such as the anti-FVIII antibody production published at NCBI PMC (Tyckhomyrov et al., PMC article). PMC

These steps yield an antibody preparation with:

  • Defined concentration (mg/mL IgG)

  • High specific titer against mRaspberry

  • Reduced background from unrelated serum antibodies

AffiAB® Goat Anti-mRuby Polyclonal Antibody

Validation and quality control for Anti-mRaspberry Polyclonal IgG

Antibody validation principles

Modern guidelines emphasize that antibodies must be validated in each intended application (WB, IF, IP, flow). Key reference frameworks include:

These reviews define validation as showing that an antibody is specific, selective and reproducible in a defined context. For Anti-mRaspberry, recommended validation includes:

  • WB detection of mRaspberry fusion vs. non-transfected negative control

  • IF staining of mRaspberry-positive vs. negative cells

  • IP of mRaspberry fusion protein, with enrichment confirmed by WB or mass spectrometry

  • Flow cytometry detection of fixed, permeabilized mRaspberry-expressing cells

Recent YCharOS / NeuroSGC projects illustrate best practices in antibody benchmarking using knockout cell lines for WB, IP and IF (e.g. Moleón et al., F1000Research antibody guides for STING1, VCP, Rab1A/B at PubMed, PubMed, PMC). PubMed+2PubMed+2

 Western blot (WB) performance

In Western blotting, Anti-mRaspberry Polyclonal IgG Antibody should detect:

  • A band corresponding to the mRaspberry-fusion protein (monomeric mRaspberry ~27 kDa + protein of interest)

  • No band in lysates from non-transfected cells under the same conditions

Quantitative fluorescent Western blot workflows (choice of secondary label, channel assignment, linear dynamic range) are described in Eaton et al., “A guide to modern quantitative fluorescent Western blotting” at NCBI PMC (quantitative WB guide). PMC

Immunofluorescence (IF / ICC) performance

For immunofluorescence, key references:

Validated Anti-mRaspberry IF staining should:

  • Co-localize with native mRaspberry fluorescence (when still visible)

  • Show correct subcellular localization (e.g., membranes, organelles, or cytosol depending on the fusion)

  • Show minimal background in non-expressing cells and no-primary controls

Immunoprecipitation (IP) and flow cytometry

IP and co-IP applications are analogous to other fluorescent-protein antibodies, as described in:

Flow cytometric detection of FP tags and their antibody-conjugate equivalents uses fluorochrome/filter tables like those from Indiana University Simon Comprehensive Cancer Center (fluorochrome descriptions PDF) and FP-compatible cytometry notes from Thermo Fisher / Attune (bioprobes FP article). microscopy.wfu.edu+1

Practical protocols using Anti-mRaspberry Polyclonal IgG Antibody

Important: Always adapt these generic conditions to the recommended dilution, buffer and incubation times from the specific product datasheet.

Indirect immunofluorescence on cultured cells (IF/ICC)

Example workflow adapted from Duke and UNL IF protocols:

  1. Cell culture and expression

    • Transfect cells with mRaspberry-tagged construct; allow sufficient expression.

  2. Fixation

    • 4% paraformaldehyde in PBS, 10–20 min at room temperature (see UNL protocol). biotech.unl.edu

  3. Permeabilization

    • 0.1% Triton X-100 or saponin in PBS for intracellular epitopes; omit for surface tags.

  4. Blocking

  5. Primary antibody incubation

    • Anti-mRaspberry Polyclonal IgG diluted in blocking buffer, typically 1–2 h at room temperature or overnight at 4 °C.

  6. Secondary antibody incubation

    • Species-appropriate secondary (e.g. anti-rabbit IgG-Alexa 488 or 647) for 1 h.

  7. Mounting and imaging

    • DAPI for nuclei, anti-fade mounting medium; confocal or widefield imaging.

For more complex samples (paraffin sections, tissue slices), a stepwise protocol is described in Zaqout et al. (IF paraffin PMC article) and Northwestern’s Bevan lab IF document (immunofluorescence-protocol.pdf). PMC+1

Western blot (WB)

  1. Sample preparation – Lyse cells expressing mRaspberry fusion, denature in SDS sample buffer.

  2. SDS-PAGE – Run appropriate gel (e.g. 10–12% acrylamide).

  3. Transfer – Transfer proteins to PVDF or nitrocellulose.

  4. Blocking – 5% milk or BSA in TBST.

  5. Primary incubation – Anti-mRaspberry Polyclonal IgG (e.g. 1:1,000–1:5,000) in blocking buffer, 1–2 h or overnight.

  6. Secondary incubation – HRP-conjugated secondary or near-IR fluorescent secondary.

  7. Detection – Chemiluminescence or IR scanner following recommendations in the quantitative Western blot guide from NCBI PMC (Eaton et al.). PMC

Immunoprecipitation (IP)

  1. Couple anti-mRaspberry IgG to Protein A/G agarose beads or use pre-conjugated beads.

  2. Incubate clarified lysate with beads, rotate 1–2 h at 4 °C.

  3. Wash beads, elute bound material by boiling in SDS sample buffer.

  4. Analyze by WB using anti-mRaspberry or anti-protein-of-interest antibodies.

Conceptually similar workflows for fluorescent protein–targeted probes and nanobodies are described in nanobody technology reviews at NCBI PMC (Beghein & Gettemans; de Beer et al.). PMC+1

Flow cytometry

For fixed, permeabilized cells:

  1. Fix cells in 1–2% paraformaldehyde (see UAMS immunotyping protocol: uams.edu). College of Medicine

  2. Permeabilize with saponin or Triton X-100 in FACS buffer.

  3. Incubate with Anti-mRaspberry Polyclonal IgG, then fluorophore-conjugated secondary antibody.

  4. Acquire on an instrument equipped with 561 or 594 nm laser and appropriate far-red detection channel, guided by fluorochrome/filter resources from Indiana University (flow fluorochrome descriptions). microscopy.wfu.edu

AffiAB® Goat Anti-mRuby Polyclonal Antibody

Advanced applications and comparison with nanobodies

Anti-mRaspberry vs. nanobody-based probes

Conventional polyclonal IgG (~150 kDa) offers broad epitope coverage and robust applications in WB, IP and IF. In contrast, nanobodies (~15 kDa single-domain antibodies) provide:

  • Smaller size → better tissue penetration, reduced linkage error in super-resolution

  • Genetic encodability as intrabodies (FP-nanobody fusions)

Extensive reviews of nanobody-based fluorescent protein probes are hosted at NCBI PMC and PubMed:

  • Chen et al., “Research progresses and applications of fluorescent protein antibodies and nanobodies” (PMC) PMC

  • Beghein & Gettemans, “Nanobody technology: versatile toolkit” (PMC) PMC

  • Carrington et al., “Exploiting nanobodies and Affimers for superresolution and single-molecule imaging” (PMC) PMC

For many standard workflows, a well-validated anti-mRaspberry Polyclonal IgG remains the simplest and most flexible solution, while nanobody-based reagents are particularly attractive for super-resolution microscopy and in vivo labeling.

Integration into multiplex IF and high-content imaging

Using Anti-mRaspberry Polyclonal IgG with spectrally separated secondaries enables:

  • Triple or quadruple IF panels (e.g., DAPI, Alexa 488, Alexa 555, Alexa 647)

  • Integration with morphological marker panels for digital pathology, as exemplified in GeoMx morphology guidelines from University of Virginia (med.virginia.edu morphology marker guidelines). PMC

Multiplex immunofluorescence for formalin-fixed samples, including dual detection of transcription factors, is described in Johns Hopkins protocols (multiplex IF staining chapter). pure.johnshopkins.edu

Storage, stability and handling

Standard storage recommendations for polyclonal IgG antibodies also apply to Anti-mRaspberry:

  • Store at −20 °C or −80 °C for long-term stability, preferably in small aliquots.

  • Avoid repeated freeze–thaw cycles.

  • Use appropriate preservative (e.g., 0.01–0.05% sodium azide) for long-term storage at 4 °C of working stocks.

These best practices mirror general antibody and protein handling advice in laboratory manuals and institutional guidelines such as Harlow & Lane’s “Antibodies: A Laboratory Manual” (cited in UCLA ARC and UMD guidelines) and ILAR Journal reviews on polyclonal antibody production (UMD guidelines PDF). Division of Research

Anti-mRaspberry Polyclonal IgG Antibody – High-Sensitivity Detection of mRaspberry Red Fluorescent Protein Tags
Anti-mRaspberry Polyclonal IgG Antibody is a high-quality research reagent raised against the monomeric red fluorescent protein mRaspberry, a far-red DsRed derivative in the mFruit fluorescent protein family. This polyclonal IgG recognizes multiple epitopes on the mRaspberry β-barrel, enabling robust detection of mRaspberry-tagged fusion proteins in immunofluorescence (IF, ICC), Western blot (WB), immunoprecipitation (IP) and flow cytometry. Antibody-based detection provides strong signal amplification compared with native mRaspberry fluorescence, improves performance in harsh fixation or antigen retrieval conditions, and supports multi-color imaging panels with GFP, mCherry and other fluorescent protein tags. Anti-mRaspberry Polyclonal IgG is ideal for applications in protein localization studies, live-cell imaging validation, co-localization analysis, biochemical pulldown of mRaspberry-fusion complexes, high-content screening and advanced microscopy workflows.
For research use only. Not for use in diagnostic procedures.

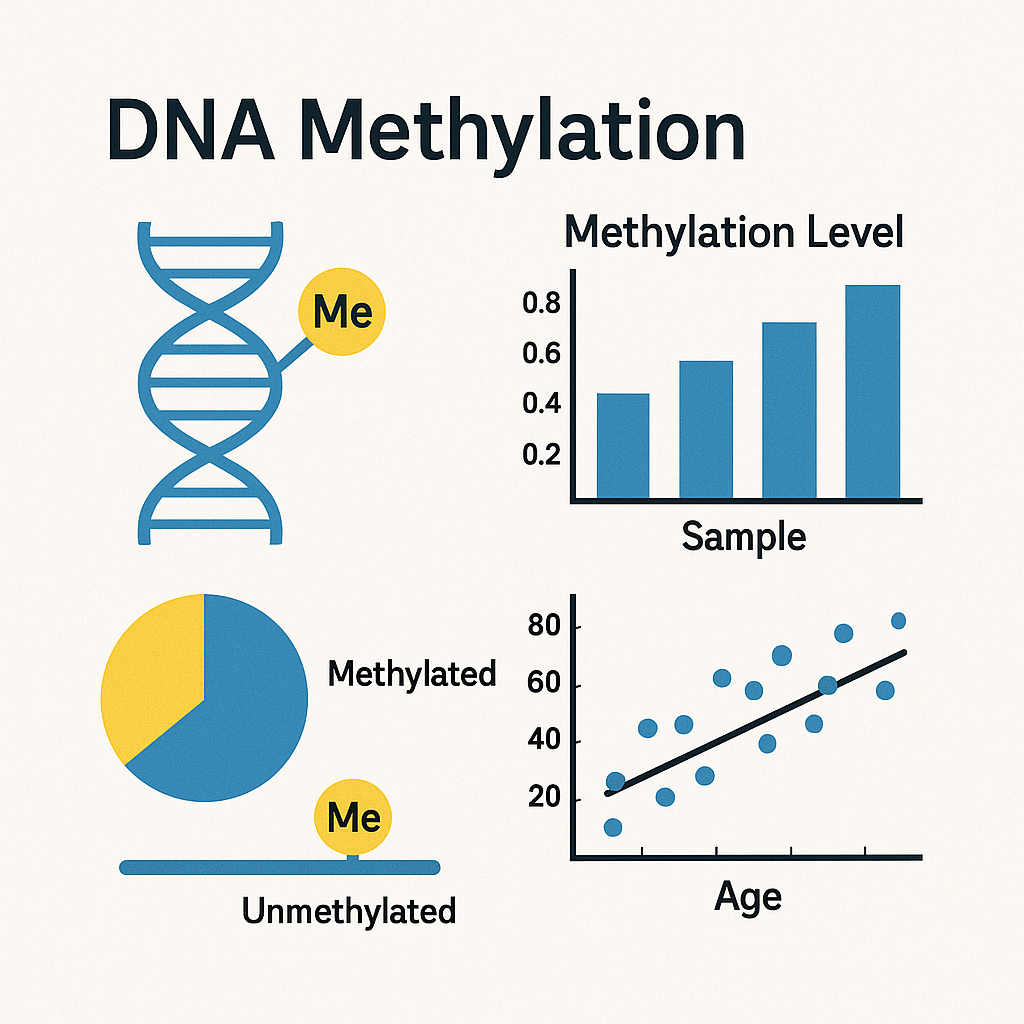
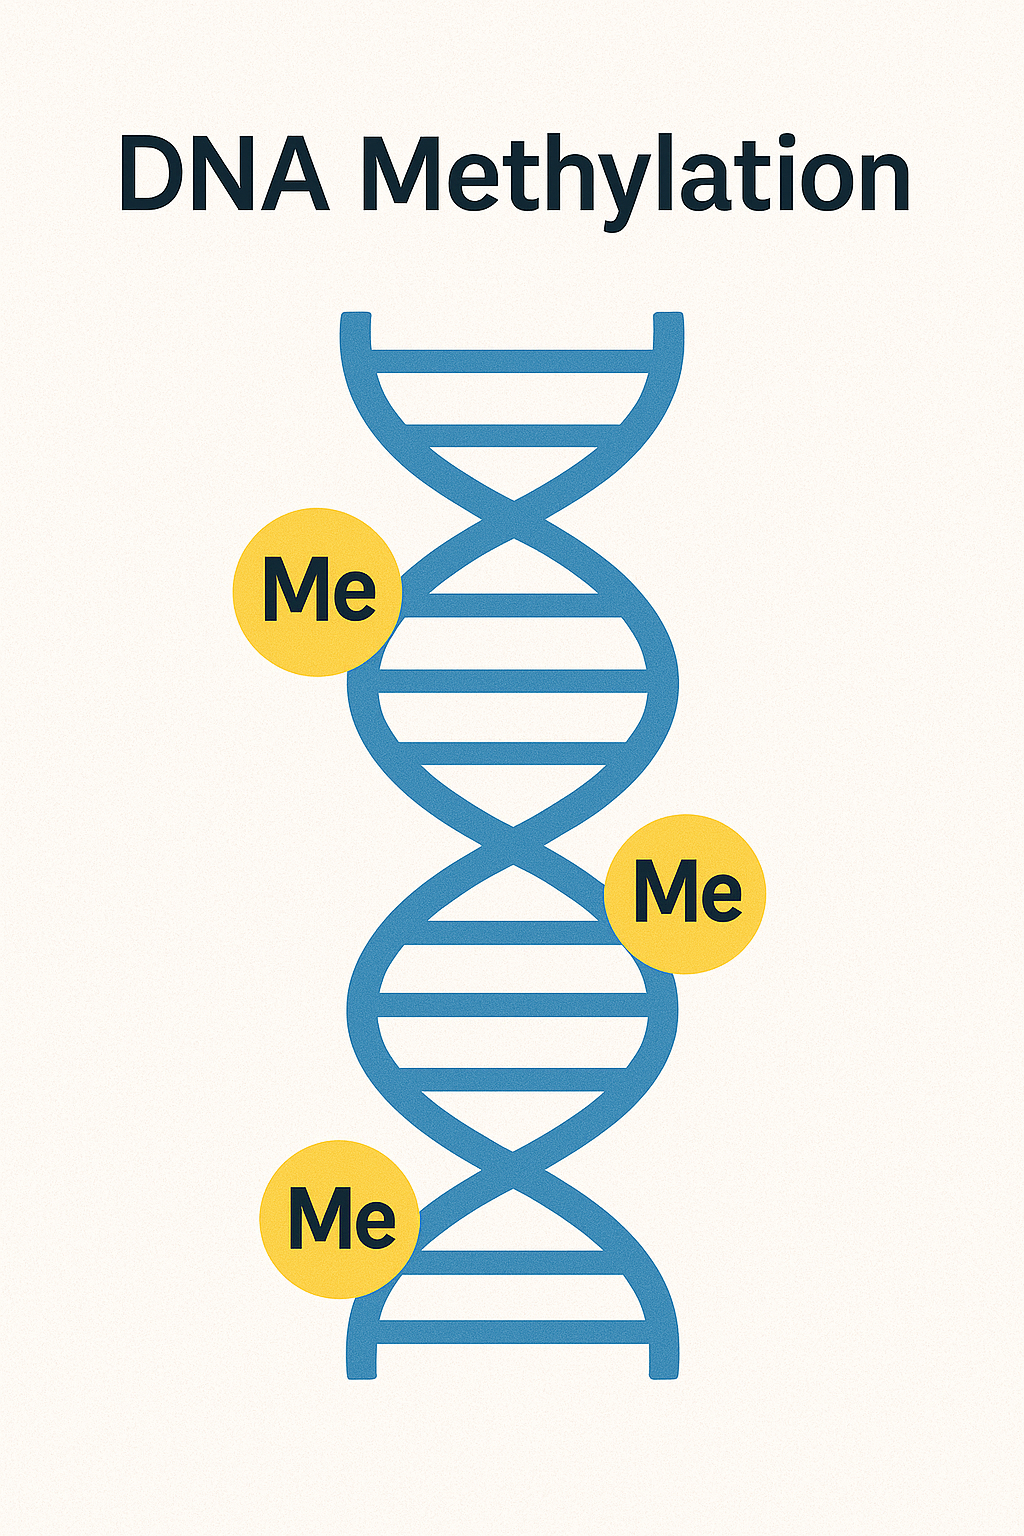
DNA Methylation: Mechanism, Genomic Context and High-Throughput Analysis

Chemical Basis and Enzymatic Machinery of DNA Methylation

 The DNMT family and 5-methylcytosine

In animals, DNA methylation is established and maintained by DNA methyltransferases (DNMTs):

  • DNMT1 – “maintenance” methyltransferase copying CpG methylation during DNA replication.

  • DNMT3A / DNMT3B – “de novo” methyltransferases that methylate previously unmethylated CpG sites.

  • DNMT3L – catalytically inactive regulatory factor in germ cells.

These enzymes transfer a methyl group from S-adenosyl-L-methionine (SAM) to cytosine C5 in the major groove. Mechanistic and structural details are summarized in reviews available via NCBI / PubMed on DNA methylation and epigenetic regulation (search “DNA methylation DNMT1 DNMT3”).

Comparative analyses across eukaryotes show that CG methylation is broadly conserved, and that Dnmt1-like maintenance methyltransferases retain similar catalytic cores in animals and plants. A classic cross-kingdom study is Feng et al., accessible via the UCSF library link to “Conservation and divergence of methylation patterning in plants and animals.” search.library.ucsf.edu

AffiNGS® EpiArt DNA Enzymatic Methylation Kit

 TET enzymes and cytosine oxidation

DNA methylation is reversible. In vertebrates, TET dioxygenases (TET1, TET2, TET3) oxidize 5mC to:

  • 5-hydroxymethylcytosine (5hmC)

  • 5-formylcytosine (5fC)

  • 5-carboxylcytosine (5caC)

These oxidized bases are then removed by the base-excision repair pathway, leading back to unmethylated cytosine. Mechanistic descriptions of TET-mediated demethylation and base-resolution mapping of 5hmC can be found in open articles at NCBI PMC on oxidative bisulfite sequencing and 5hmC mapping. Academia

 Passive demethylation during replication

Passive DNA demethylation occurs when DNMT1 is inhibited or absent during DNA replication. Newly synthesized strands remain unmethylated, and methylation density decreases with each cell cycle. This replication-coupled dilution is important in pre-implantation embryos and primordial germ cells, as summarized in reprogramming reviews available in NIH Roadmap Epigenomics perspectives at commonfund.nih.gov/epigenomics. commonfund.nih.gov+1

Sequence Context and Genomic Distribution

 CG vs CHG vs CHH methylation

DNA methylation is often classified by sequence context:

  • CG methylation – predominant in vertebrates; symmetric (CpG on both strands).

  • CHG methylation – common in plants, symmetric, maintained by plant-specific CMT3 enzymes.

  • CHH methylation – asymmetric site; heavily used in plants for transposon silencing.

Reviews from Purdue University (“Dynamics and function of DNA methylation in plants,” PDF hosted at purdue.edu) and the Washington University in St. Louis biology department news (biology.wustl.edu) provide detailed descriptions of CG/CHG/CHH methylation and the associated methyltransferases in Arabidopsis and other plant species. Department of Biology+1

CpG islands, shores and shelves in vertebrate genomes

In mammalian genomes:

  • CpG islands are short (typically 300–3,000 bp), GC-rich regions enriched for CpG dinucleotides, often overlapping promoters and first exons.

  • CpG shores (0–2 kb from islands) and CpG shelves (2–4 kb from islands) are frequent sites for differential methylation in epigenome-wide association studies (EWAS).

Classical work on CpG islands, their features and relation to transcription is summarized in Deaton & Bird, accessible via Oxford Academic and often mirrored through institutional links (e.g. University of California or other .edu libraries). Academia

Promoter CpG islands of housekeeping genes are usually unmethylated, supporting open chromatin and transcription. In contrast, CpG islands associated with tissue-restricted or developmentally regulated genes may be methylated in non-expressing cell types.

 Non-CpG (CpH) methylation in neurons and pluripotent cells

Non-CpG methylation (mCpH, H = A/C/T) is abundant in embryonic stem cells and post-mitotic neurons. It accumulates during neuronal maturation and is enriched in gene bodies and regulatory elements. Reviews and primary data on neuronal non-CpG methylation are available via NCBI PubMed and in open access at NCBI PMC (search “non-CpG methylation neurons 5hmC”).

These studies show that non-CpG methylation is recognized by MeCP2 and other methyl-binding proteins and contributes to fine-tuning of gene expression in the nervous system.

Organismal Diversity of DNA Methylation

 Vertebrates and invertebrates

Comparative methylome studies show that:

  • Vertebrates typically have high global CpG methylation with unmethylated CpG islands.

  • Some invertebrates (e.g. honeybee, sea squirt) have methylation targeted mainly to gene bodies.

  • Other model organisms (e.g. Saccharomyces cerevisiae, Caenorhabditis elegans) have almost no detectable 5mC in genomic DNA. search.library.ucsf.edu

These observations are important for SEO phrases like “DNA methylation evolution”, “gene body methylation” and “epigenetic diversity in eukaryotes”.

 DNA methylation in plants (CG, CHG, CHH)

Plant genomes show extensive methylation in CG, CHG and CHH contexts:

  • CG methylation in gene bodies and some promoters.

  • CHG / CHH methylation enriched in transposable elements (TEs) and repeats.

  • Distinct plant-specific methyltransferases such as CMT3 and DRM2 maintain non-CG methylation.

Comprehensive reviews on plant DNA methylation and its dynamics are available in PDFs hosted at Purdue University and other academic sites, such as:

These resources highlight how plant DNA methylation responds to abiotic and biotic stress, supports transposon silencing, and can be inherited across generations.

 DNA methylation in transposable elements and repetitive DNA

Across eukaryotes, DNA methylation is a key mechanism for transposable element (TE) silencing. A detailed analysis of the epigenomic landscape of TEs across many tissues is provided by Pehrsson et al. in Nature Communications, available openly at NCBI PMC: “The epigenomic landscape of transposable elements across normal human tissues”. PMC

This work integrates DNA methylation, histone modifications and chromatin accessibility to show how TEs are differentially regulated in human cell types.

Functional Roles of DNA Methylation

 Gene regulation and chromatin compaction

Key mechanisms linking DNA methylation to gene regulation:

  1. Direct interference – 5mC at transcription factor binding sites can reduce DNA-protein binding.

  2. Reader proteins – methyl-binding domain proteins (MBDs, MeCP2, etc.) bind methylated DNA and recruit histone deacetylases and chromatin remodelers, creating repressive chromatin.

  3. Cross-talk with histone marks – DNA methylation interacts with histone modifications (e.g. H3K9me3) to stabilize heterochromatin.

These concepts are summarized in the NIH Roadmap Epigenomics Consortium overview and in reference epigenome analyses such as Kundaje et al., “Integrative analysis of 111 reference human epigenomes,” accessible at NCBI PMC. PMC+1

 Development, imprinting and dosage regulation

During early development, the genome undergoes global demethylation and remethylation, while specific loci retain methylation as imprints. These imprinted differentially methylated regions (DMRs) control parent-of-origin gene expression.

DNA methylation also contributes to:

  • X-chromosome inactivation in female mammals.

  • Stabilization of cell-type-specific transcription programs.

  • Prevention of aberrant activation of embryonic and germline genes in somatic tissues.

These functions are described in epigenetic reprogramming reviews linked through NIH and NCBI (search “DNA methylation dynamics epigenetic reprogramming”). PMC

 Environmental responses and epigenetic variation

External factors—such as nutrient availability, temperature, stress and chemical exposures—can be associated with changes in DNA methylation patterns. In plants, stress-induced methylation changes are documented in reviews like Kumar et al. and Lodhi et al., focusing on abiotic stress and plant physiology, both accessible via academic and institutional repositories. librarysearch.chemeketa.edu+1

Population-level DNA methylation datasets raise questions about data interpretation, privacy and re-identification, discussed in policy-oriented work such as Dyke et al., “Epigenome data release: a participant-centered approach,” at NCBI PMC. PMC

Experimental Methods for DNA Methylation Analysis

 Bisulfite conversion–based methods

Sodium bisulfite conversion is the gold standard for base-resolution DNA methylation analysis:

  • Unmethylated cytosine → uracil (C→T after PCR).

  • 5mC remains as C.

Main techniques:

  1. Whole-genome bisulfite sequencing (WGBS) – genome-wide CpG and non-CpG methylation at single-base resolution.

  2. Reduced representation bisulfite sequencing (RRBS) – enriches CpG-rich regions for cost-efficient profiling.

  3. Targeted bisulfite sequencing – captures selected loci or panels.

A practical WGBS tutorial is provided by UCLA QCBio in “Workshop 6 – WGBS,” PDF at qcb.ucla.edu. Academia

Workflows for plant and animal DNA methylation analysis with WGBS and RRBS, including adapter trimming and mapping, are reviewed in Omony et al. “DNA methylation analysis in plants: review of computational tools,” accessible via Oxford Academic / Briefings in Bioinformatics and mirrored in HTML on academic platforms. Academia

 Array-based DNA methylation profiling (Illumina 450K and EPIC)

The Illumina HumanMethylation450 BeadChip (450K) and Infinium MethylationEPIC BeadChip are widely used for epigenome-wide association studies (EWAS). They measure methylation at hundreds of thousands of CpG sites.

Key methodological references (all open access at NCBI PMC, a .gov resource):

  • Okamura et al. – probe content and annotation of 450K. Academia

  • Lehne et al. – “A coherent approach for analysis of the Illumina 450K array.” Academia

  • Pidsley et al. – critical evaluation of the EPIC array. Academia

  • Kundaje et al. – integrative analysis of 111 reference epigenomes, including 450K data. PMC

These articles detail normalization, probe filtering, batch correction and differential methylation analysis, forming a standard pipeline for EWAS-style DNA methylation profiling.

 Enrichment-based methods (MeDIP-seq, MBDCap-seq, Methyl-Capture)

Before WGBS became standard, many studies used enrichment of methylated DNA:

  • MeDIP-seq – immunoprecipitation using antibodies against 5mC.

  • MBDCap-seq – capture of methylated DNA using methyl-CpG-binding domains.

  • Methyl-Capture – hybridization-based enrichment of CpG-dense regions.

These methods provide regional methylation profiles at lower cost and can still be useful for screening large sample cohorts, as described in methodological reviews on NCBI PMC and in epigenomics resource guides. PMC

 Direct detection with long-read sequencing

New long-read platforms enable direct detection of cytosine modifications:

  • PacBio HiFi “5-base sequencing” infers 5mC from polymerase kinetics; an application brief is hosted at UMass Chan Medical School: “Measuring DNA methylation with 5-base HiFi sequencing”. repositori.upf.edu

  • Oxford Nanopore devices detect methylation from changes in ionic current, enabling real-time DNA methylation sequencing of long molecules; overviews are provided in reviews on profiling genome-wide DNA methylation at NCBI PubMed / PMC. Academia

These methods support advanced SEO phrases like “long-read DNA methylation sequencing”, “5-base HiFi epigenome profiling”, and “nanopore DNA methylation assay”.

Single-Cell and Multi-Omic DNA Methylation

 Single-cell DNA methylome sequencing

Single-cell bisulfite sequencing (scBS-seq) and related methods combine ultra-low-input bisulfite conversion with indexing strategies to profile DNA methylation at the single-cell level. These approaches capture cell-to-cell heterogeneity in CpG methylation and can be integrated with single-cell RNA-seq or single-cell ATAC-seq.

Many protocols and benchmarking studies are accessible via NCBI PMC and university sequencing cores (e.g. Northwestern University NUSeq – DNA methyl-seq services). Academia

 Integration with chromatin accessibility and histone marks

ATAC-seq and DNA methylation can be combined to model chromatin accessibility and methylation state at regulatory elements. For example, Zhong et al. describe how DNA methylation-linked chromatin accessibility shapes transcription in plants, accessible as a PDF from UCLA at research.mcdb.ucla.edu. research.mcdb.ucla.edu

At the consortium level, NIH Roadmap Epigenomics and ENCODE provide integrated datasets of DNA methylation, histone modifications and DNase/ATAC-seq. Users can browse these data at:

Public Epigenome Resources and Data Portals

 NIH Roadmap Epigenomics Mapping Consortium

The NIH Roadmap Epigenomics Mapping Consortium generated large reference datasets of DNA methylation, histone marks and open chromatin across many human cell types and tissues. Its goals and design are described in:

These datasets are accessible through:

 International Human Epigenome Consortium (IHEC)

The International Human Epigenome Consortium (IHEC) coordinates international epigenome projects and exposes unified datasets through the IHEC Data Portal. The portal is described in “The International Human Epigenome Consortium Data Portal” at NCBI PubMed: pubmed.ncbi.nlm.nih.gov/27863956. PubMed

IHEC integrates data from ENCODE, NIH Roadmap, Blueprint, DEEP, and other consortia, enabling cross-study comparison of DNA methylation and related marks.

 Epigenome browsers and visualization tools

A guide to epigenome browsers and data resources is provided by Karnik et al. in “A guide to data resources and epigenome browsers for human epigenome project data,” available at NCBI PMC: pmc.ncbi.nlm.nih.gov/articles/PMC3750740. PMC

This guide covers:

  • The UCSC Genome Browser (University of California, Santa Cruz – genome.ucsc.edu)

  • The WashU Epigenome Browser (Washington University in St. Louis – epigenomegateway.wustl.edu)

  • Specialized viewers for Roadmap and ENCODE datasets

These platforms host high-density tracks of DNA methylation, making them central for DNA methylation analysis, EWAS visualization, and regulatory annotation.

Computational Pipelines for DNA Methylation Data

Pre-processing of bisulfite sequencing

Typical computational steps for WGBS / RRBS:

  1. Quality control and adapter trimming (e.g. Trimmomatic).

  2. Bisulfite-aware alignment to the reference genome (e.g. Bismark, BS-Seeker, BS-Seeker3, WALT, GEMBS).

  3. Methylation calling at each cytosine.

  4. Aggregation of methylation proportions per CpG or region.

The review “DNA methylation analysis in plants: review of computational tools” lists many tools and their use cases, including BS-Seeker2/3, WALT, BiQ Analyzer, BSeQC, and DMR callers such as Metilene, DMRcaller and others. Academia

EWAS and differential methylation

In epigenome-wide association studies:

  • Beta values (methylated intensity / total) or M-values (logit transform) are used.

  • Linear models and mixed models capture associations with traits or exposures.

Statistical frameworks for differentially methylated loci (DML) and differentially methylated regions (DMR) are reviewed in detail in Omony et al. and in genome-wide epigenomics methods papers linked through NCBI PMC. Academia+1

 Integration with genomic annotations

DNA methylation data are typically intersected with:

  • Promoters, enhancers and CpG islands (from UCSC or Ensembl).

  • ChromHMM/Segway chromatin states from ENCODE and Roadmap.

  • Transposable element annotations (e.g. from RepeatMasker tracks).

Epigenome browsers described by Karnik et al. provide built-in tools to overlay DNA methylation with these tracks. PMC

Experimental Design, Controls and Quality Metrics

 Technical controls

Robust DNA methylation assays usually include:

  • Unmethylated control DNA (e.g. lambda phage DNA) to monitor bisulfite conversion efficiency.

  • Fully methylated control DNA to check assay sensitivity.

  • Sample replicates to estimate technical variance.

Guidelines on coverage recommendations and QC for WGBS are summarized in methodological reviews referenced in Omony et al. and related articles at NCBI PMC. Academia

 Quality control metrics

Common QC metrics:

  • Conversion rate (fraction of non-CpG cytosines converted to T).

  • Global CpG methylation levels compared with expectations for given cell types.

  • Coverage distribution and CpG read depth.

  • Replicate concordance (e.g. Pearson correlation of methylation profiles).

Visualization and QC tools, such as BiQ Analyzer and BSeQC, are discussed in Omony et al. and related software articles (Bioinformatics journal). Academia

You can reuse this block directly in your Affigen / Gentaur / health.gentaur.com pages:

DNA Methylation – Epigenetic Cytosine Modification and Genome-Wide Profiling
DNA methylation is a key epigenetic modification in which methyl groups are added to cytosine residues, mainly at CpG sites, generating 5-methylcytosine. This covalent change does not alter the DNA sequence but has major effects on gene regulation, chromatin structure, genomic imprinting, X-chromosome inactivation, transposon silencing and long-term epigenetic memory. Modern DNA methylation analysis combines bisulfite conversion, whole-genome bisulfite sequencing (WGBS), reduced representation bisulfite sequencing (RRBS), targeted bisulfite assays, Illumina 450K and MethylationEPIC arrays, and long-read DNA methylation sequencing with advanced bioinformatics pipelines for differential methylation and epigenome-wide association studies (EWAS). Public epigenome resources such as the NIH Roadmap Epigenomics Program, ENCODE, and the International Human Epigenome Consortium (IHEC) provide thousands of reference DNA methylation maps across human tissues and cell types, enabling integrative analysis of CpG methylation, non-CpG methylation, chromatin accessibility and histone modifications.

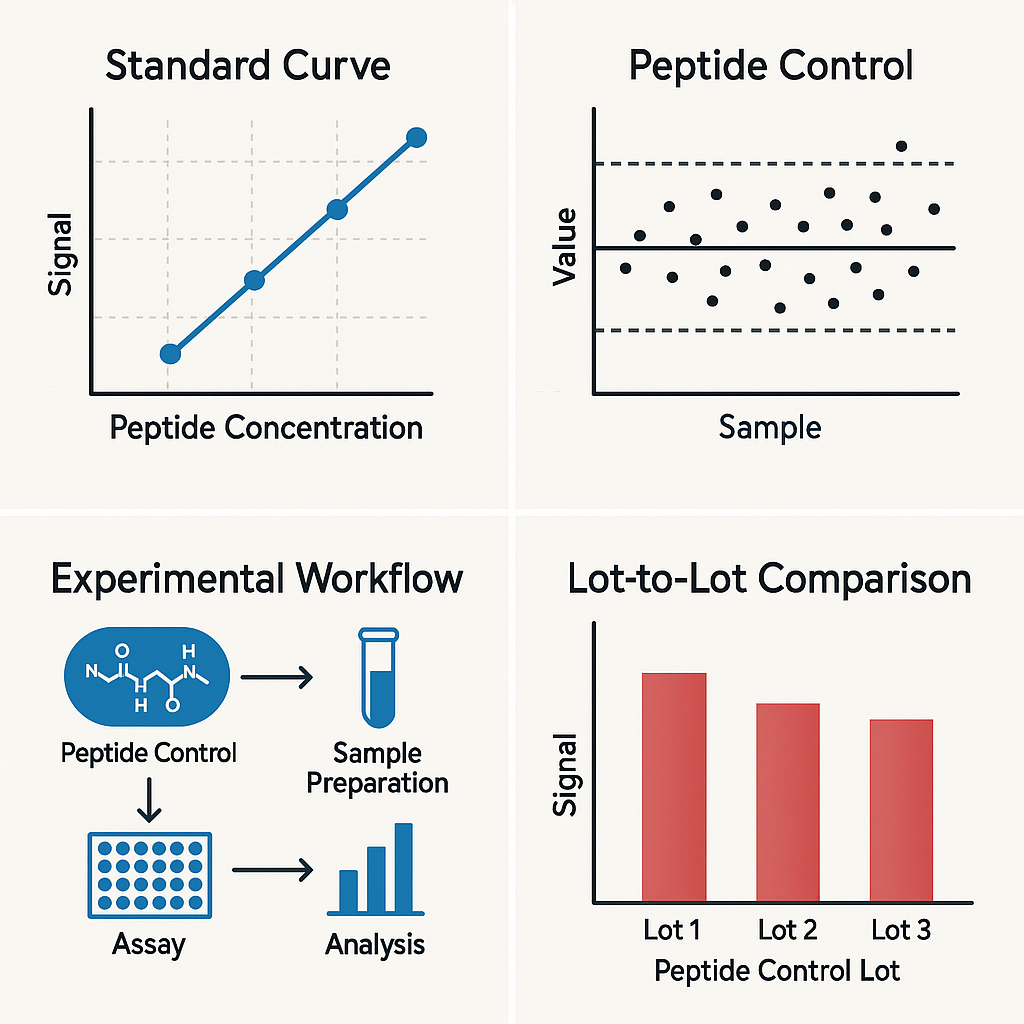
Peptide Control: High-Specificity Reference Material for Assay Validation, Protein Quantification, and Analytical Calibration

Peptide control (or peptide standard) is a synthetic peptide reagent used as a reference material in analytical workflows. It provides a stable, well-characterized signal for calibration, normalization and quality control in peptide and protein assays such as LC–MS/MS proteomics, HPLC and immunoassays.

Institutes like NIST maintain dedicated peptide mass spectral libraries and peptide reference materials to support these applications, for example the NIST peptide mass spectral libraries, NIST Standard Reference Database 1c and peptide mixtures such as RM 8321 “Peptide Mixture for Proteomics”. NIST+2NIST+2

This article gives a technical, SEO-optimized overview of peptide control reagents, focusing on:

  • What peptide controls are

  • Types of peptide controls and standards

  • Design and synthesis parameters

  • Use of peptide controls in LC–MS/MS

  • Use in immunoassays and epitope mapping

  • Storage, stability and documentation

Throughout the text, you will find multiple .edu and .gov hyperlinks for deeper reference.

AffiGEN® Peptide Control

What is a peptide control?

A peptide control is a synthetic peptide with known sequence, purity, concentration and physicochemical properties that is introduced into an analytical system to:

  • Verify correct instrument performance

  • Establish calibration curves

  • Monitor day-to-day assay precision and trueness

  • Detect matrix effects, losses and analytical drift

In LC–MS/MS proteomics and peptide quantification, reference laboratories use well-characterized peptide mixtures such as NIST reference material 8321 and SRM 998 Angiotensin I as benchmark peptide controls for method validation and amino-acid analysis calibration. INNTech+1

Guidelines for peptide reference standards and quality attributes have been published by expert groups and regulatory scientists, for example in open resources hosted at NCBI / PubMed Central and NIH. PMC+1

Why peptide controls are essential in analytical workflows

 Control of mass spectrometry performance

In LC–MS/MS, peptide control standards are used to monitor:

  • Retention time stability

  • Mass accuracy and resolution

  • Fragmentation pattern reproducibility

  • Instrument sensitivity and limit of detection

Mass spectral libraries such as the NIST peptide fragmentation libraries and their description in the data.gov catalogue provide curated MS/MS spectra that serve as reference for evaluating peptide control signals and identification confidence. chemdata.nist.gov+1

Research articles on mass spectral analysis of synthetic peptides emphasize the need for well-defined peptide controls to evaluate identification algorithms and minimize false discovery rates. You can see typical strategies in open access articles archived at NCBI PMC. PMC

 Quantitative proteomics and internal standards

For absolute quantification, peptide controls are often stable isotope-labeled internal standards spiked into each sample at a fixed amount. The ratio of endogenous peptide area to the labeled peptide control is used to calculate concentration, as described in multiple quantitative proteomics workflows hosted on PubMed and NCBI PMC. PubMed+1

Consensus recommendations for amino-acid analysis and peptide standardization stress the importance of in-house peptide control solutions and their traceability to reference methods. These are detailed in guidance papers available via NCBI PMC and NCBI peptide standardization resources. PMC+1

Classes of peptide control materials

In practice, “peptide control” can refer to several functional categories of synthetic peptides:

  1. Calibration peptide standards

    • Used to generate calibration curves (e.g. 0.1–1000 fmol range).

    • Often traceable to certified or reference materials like NIST RM 8327 and SRM 998. INNTech

  2. Internal standard peptide controls

    • Stable isotope-labeled analogues of target peptides (e.g. ^13C/^15N).

    • Synthesis and application strategies are documented in open-access studies archived at NCBI PMC and PubMed. PMC+1

  3. System suitability controls

  4. Positive and negative control peptides in immunoassays

  5. Multiplexed and universal peptide controls

    • Recombinant or synthetic constructs that provide multiple reporter peptides in a single reagent.

    • Examples include recombinant peptide calibration standards such as PAS-cal, described in open access at NCBI PMC, and multiplexed standards for targeted proteomics like those at NCBI PMC. PMC+1

Key design parameters for a robust peptide control

When designing a Peptide Control product for LC–MS/MS, HPLC or immunoassays, several technical parameters are critical:

  1. Peptide sequence selection

    • Unique sequence (proteotypic peptide) without known post-translational modification sites for LC–MS/MS controls.

    • For immunoassay peptide controls, choose a validated epitope or binding sequence, drawing on epitope mapping data from academic resources such as Harvard and MHC-binding assays from URI. ADS+1

  2. Length and composition

    • Typical length: 7–25 amino acids for LC–MS/MS peptide controls, balancing ionization efficiency and chromatographic behavior.

    • Avoid sequences with extreme hydrophobicity or multiple labile residues unless they are necessary for biological relevance.

  3. Chemical purity and identity

    • Verified by HPLC, LC–MS and amino-acid analysis.

    • NIST reference materials like SRM 998 illustrate documentation formats for purity, identity and uncertainty. INNTech

  4. Labeling strategy (for internal standards)

    • Uniform ^13C/^15N labeling at specific lysine/arginine or global labeling along the sequence.

    • Detailed strategies for stable isotope-labeled peptide controls can be found in studies at PubMed and NCBI PMC. PubMed+1

  5. Solubility and formulation

    • Selection of counter-ion (e.g. acetate vs. trifluoroacetate) and buffer composition to ensure reproducible dissolution, as discussed in peptide production evaluations at PubMed. PubMed

Peptide control in LC–MS/MS proteomics

 Peptide control for method development

In targeted and global proteomics, Peptide Control is central for:

  • Optimization of MRM/SRM transitions

  • Verification of chromatographic separation (peak shape, resolution)

  • Evaluation of ion suppression and matrix effects

Protocols for selected reaction monitoring are extensively described in step-by-step form at NCBI PMC and NCBI PMC quantitative method tutorials. PMC+1

Academic groups at Princeton University and MIT show how peptide standards can be combined with multiplexing strategies or used to optimize transitions for absolute quantification of protein panels. oar.princeton.edu+1

 Multi-peptide and recombinant peptide controls

To reduce cost and simplify workflows, several groups use recombinant multi-peptide standards:

  • QconCAT and similar concatenated peptide genes

  • Cell-free synthesized isotopically labeled peptide mixtures

  • Recombinant standards like PAS-cal, presented as a generic peptide calibration tool at NCBI PMC. PMC

These strategies are described in methodological papers accessible via NCBI PMC peptide standardization and in targeted proteomics guidelines. PMC

 System suitability and long-term quality control

Standard operating procedures often include:

  • Daily injection of a system suitability peptide control mix

  • Plotting retention time, peak area and signal-to-noise ratio against predefined acceptance ranges

  • Using control charts to detect drift, as in LC–MS method evaluations found at NCBI PMC and Scripps mass spectrometry resources. PMC+1

Peptide control in immunoassays and epitope mapping

 Positive and negative peptide controls

In ELISA, bead-based assays and microarrays, peptide control reagents include:

  • Positive peptide controls: high-affinity binders that ensure the detection system is functional.

  • Negative peptide controls: unrelated peptides used to confirm background binding and specificity.

Method descriptions in university repositories, for example at Virginia Tech and Emory, provide concrete examples of how peptide controls are integrated into T-cell activation and immunoassay readouts. VTechWorks+1

 Peptide arrays and pathway-level controls

In peptide microarrays, hundreds to thousands of peptide sequences are immobilized and probed with antibodies or other binding proteins. Synthetic peptide standards are used to:

  • Validate printing quality

  • Normalize array-to-array signals

  • Benchmark detection limits

Array-based approaches for pathway-level protein phosphorylation analysis are detailed in open-access studies at NCBI PMC, while high-throughput binding assays and immunoassay innovation are discussed in resources from UC San Diego and Upenn. PMC+2kummelgroup.ucsd.edu+2

Preparation, storage and stability of peptide controls

 Lyophilization and reconstitution

Most Peptide Control products are supplied as lyophilized powders to maximize stability. Best practices include:

  • Lyophilizing from volatile buffers compatible with LC–MS (e.g. ammonium bicarbonate).

  • Reconstituting in LC–MS grade water or suitable organic solvent mix.

  • Avoiding repeated freeze–thaw cycles by aliquoting.

Practical examples of peptide standard preparation are provided in technical protocols from Rockefeller University and in method sections of LC–MS/MS applications archived at NCBI PMC. macromolecule-child.rockefeller.edu+1

 Stability studies and reference materials

Reference institutions perform stability studies on peptide standards, evaluating:

  • Long-term storage at −20 °C / −80 °C

  • Short-term bench stability

  • Freeze–thaw robustness

These studies are documented in NIST reports such as 8327 Peptide Reference Material and SRM 998 Angiotensin I. INNTech+1

Technical reviews on synthetic peptide reference standards at NCBI PMC summarize vialing, lyophilization, analytical testing and long-term stability, which are directly relevant for designing and qualifying Peptide Control products. PMC

Data analysis, normalization and QC metrics using peptide control

After acquisition, peptide control signals are used in data processing workflows to ensure robust quantification:

  1. Peak integration and transition ratios

    • Check that monitored transitions for the peptide control have the expected transition ratio pattern, as described in SRM/MRM protocols at NCBI PMC. PMC

  2. Response factors and calibration curves

  3. Normalization and batch correction

    • Normalize target peptide abundances to internal peptide controls to minimize batch effects and instrumental drift, as illustrated in quantitative proteomics papers available via NCBI PMC. PMC

  4. QC acceptance criteria

    • Typical acceptance criteria for a Peptide Control may include: retention time within ±2 %, peak area within predefined limits and signal-to-noise above a given threshold; such metrics are often reported in LC–MS method validations hosted on NCBI PMC. PMC

For e-commerce and product pages, the following keyword-rich summary block can help search engines index “Peptide Control” products:

Peptide Control – Synthetic Peptide Standard for LC–MS/MS, HPLC and Immunoassays
Peptide Control is a high-purity synthetic peptide standard designed for calibration, internal standardization and system suitability in peptide and protein assays. This peptide control supports quantitative LC–MS/MS proteomics, targeted MRM/SRM methods, HPLC peptide profiling and peptide-based immunoassays by providing a stable, well-characterized reference signal. Using a Peptide Control improves assay precision, trueness, linearity and reproducibility, and facilitates method validation, inter-run comparison and long-term quality control in research laboratories.

Ticarcillin Supplement: Technical Overview, Mechanism, Stability Profiles and Laboratory Applications

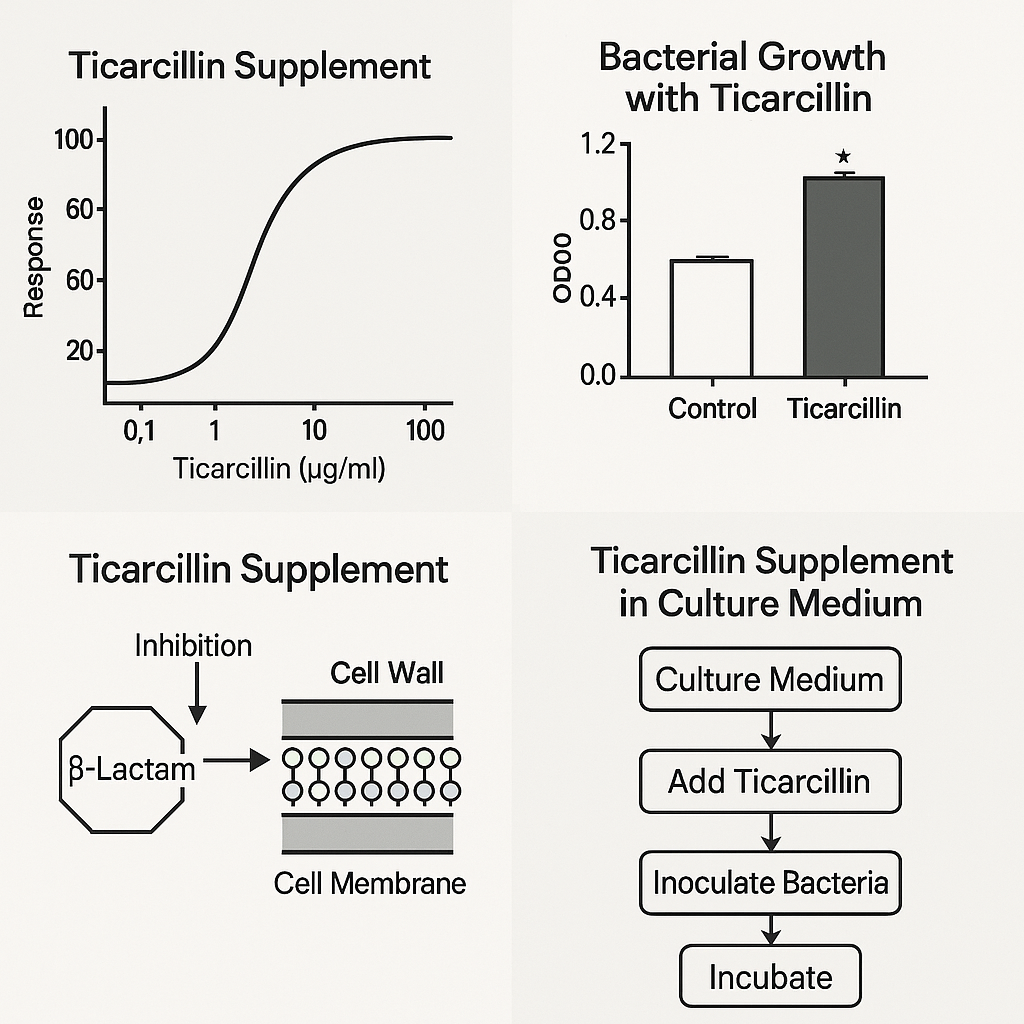
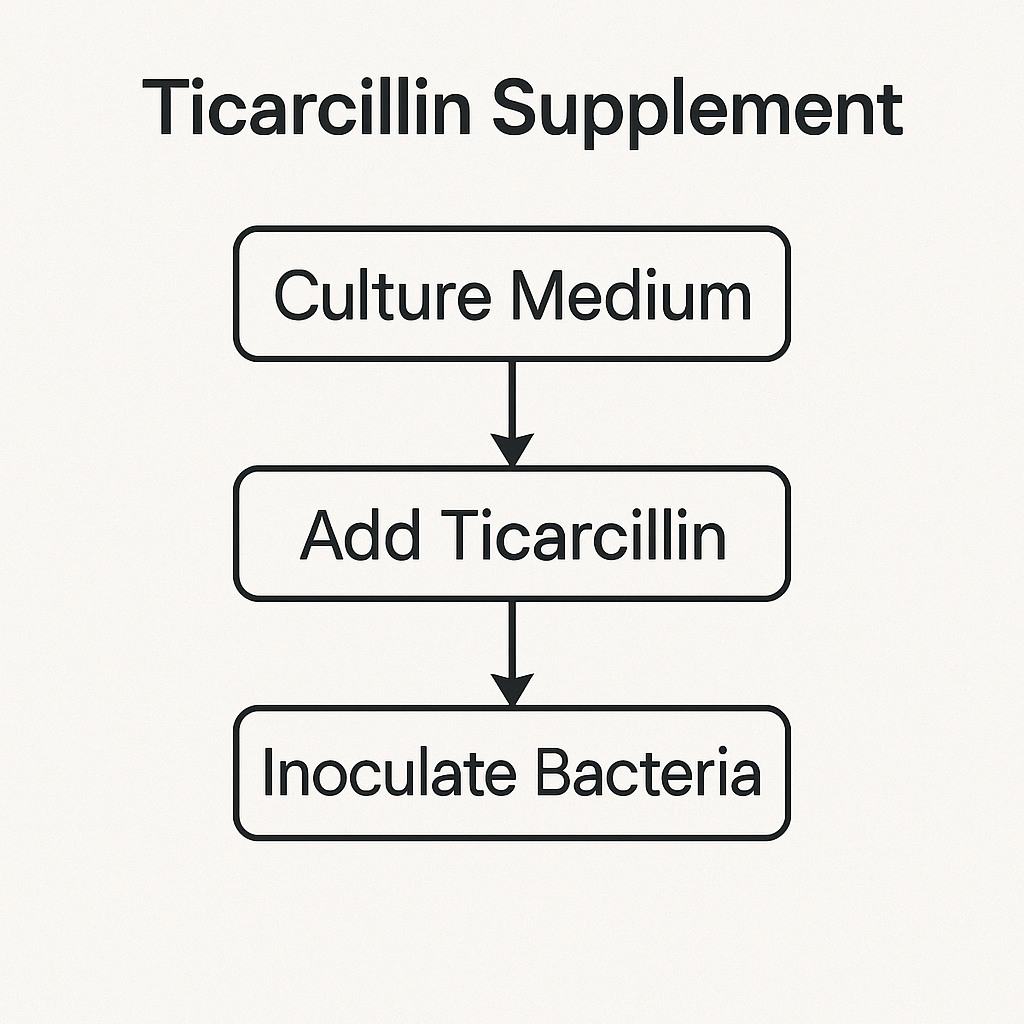
Ticarcillin Supplement is widely used in molecular biology, microbiology, and recombinant DNA workflows as a β-lactam antibiotic derivative optimized for selection of plasmid vectors, suppression of background colonies, and maintenance of high-copy plasmid stability in Escherichia coli and related Gram-negative species. As a semi-synthetic carboxypenicillin, Ticarcillin demonstrates improved resistance to β-lactamase hydrolysis compared to ampicillin, enabling more stable selection pressure during long incubations and high-density culture growth.

In modern molecular biology pipelines, Ticarcillin Supplement plays a crucial role in workflows associated with PCR cloning, vector propagation, library amplification, bacterial transformation QC, and synthetic biology circuit stability. Many academic laboratories, government research programs, and NIH-supported projects recommend Ticarcillin for experiments requiring consistent antibiotic activity and reduced satellite colony formation.

For context, β-lactam mechanisms are well described in educational resources such as NIH’s NCBI Bookshelf (https://www.ncbi.nlm.nih.gov/books/), National Library of Medicine (https://www.nlm.nih.gov), CDC antibiotic mechanism documentation (https://www.cdc.gov/), and fundamental microbiology curricula hosted by MIT OpenCourseWare (https://ocw.mit.edu), Harvard GSAS resources (https://gsas.harvard.edu), and UC Davis Microbiology (https://microbiology.ucdavis.edu).

AffiGEN®  Ticarcillin Supplement (1mg/vl)

Chemical and Structural Characteristics of Ticarcillin

Ticarcillin belongs to the carboxypenicillin family and exhibits a β-lactam ring structure responsible for disrupting bacterial peptidoglycan cross-linking. Its chemical and structural principles are frequently referenced in:

Key properties for laboratory use:

  • Highly stable in lyophilized form

  • Soluble in sterile water

  • Rapid diffusion in agar

  • Minimal degradation under standard culture conditions

Compared to ampicillin, Ticarcillin maintains higher activity in overnight cultures and high-glucose LB systems, reducing inconsistent selection pressure.

Mechanism of Action and Selection Efficiency

Ticarcillin functions as a transpeptidase inhibitor, blocking PBPs (penicillin-binding proteins) involved in cell-wall synthesis. Its inhibitory properties are described in government and academic resources, including:

Ticarcillin’s improved resistance to β-lactamase degradation ensures:

  • Lower incidence of satellite colonies than ampicillin

  • More uniform selection during long incubations (12–20h)

  • Reduced plasmid dropout in high-copy cloning vectors

  • Stable maintenance of selection markers (bla, carbenicillin-resistant variants)

Laboratory Applications in Molecular Cloning and Microbial Engineering

Ticarcillin Supplement is routinely applied in:

A. Plasmid Propagation and High-Fidelity Vector Maintenance

Used in LB, TB, SOC, SOB, and M9 cultures for plasmids carrying β-lactam resistance genes.

B. Bacterial Transformation Quality Control

Government-funded protocols hosted at:

…all reference carboxypenicillin derivatives as preferred selection reagents.

C. High-Throughput Screening in Synthetic Biology

Used in:

  • CRISPR library propagation

  • Metabolic engineering constructs

  • Genetic circuit maintenance

  • RNA-guided plasmid libraries

D. Reduction of Satellite Colonies

A major advantage over ampicillin, as documented by:

Stability and Performance Parameters

Academic references from Cornell CALS (https://cals.cornell.edu), Michigan State University Microbiology (https://microbiology.msu.edu), and Berkeley Biosciences (https://bioscience.berkeley.edu) highlight several performance advantages:

  • High thermal stability in standard incubator ranges (30°C–37°C)

  • Reliable maintenance of plasmid selection in auto-induction media

  • Low spontaneous resistance rate compared to older penicillin derivatives

Under typical use, Ticarcillin remains active for 3–4 months at −20 °C in stock solutions and maintains at least 90% selection efficiency over multiple passages.

Typical Concentrations and Use Conditions (Research-Only)

(General research guidelines—non-YMYL)

Agar Plates

  • 50–100 µg/mL for standard selection

  • 100 µg/mL recommended for high-density transformations

Liquid Cultures

  • 25–50 µg/mL for overnight cultures

  • 100 µg/mL for high-copy plasmids or low aeration flasks

Supporting academic references:

Compatibility in Modern Molecular Biology Pipelines

Ticarcillin is compatible with:

  • Gateway cloning vectors

  • TOPO, TA, blunt-end cloning

  • High-copy pUC-origin plasmids

  • CRISPR-Cas9 expression systems

  • Gibson Assembly workflows

  • Golden Gate Assembly constructs

  • Lambda-red recombineering plasmids

These systems are widely documented across academic institutions such as:

Advantages Over Other β-Lactam Antibiotics

Research groups in numerous .edu domains describe the benefits of Ticarcillin over other penicillins:

Feature Ampicillin Carbenicillin Ticarcillin
Satellite colony reduction Low Medium High
β-lactamase degradation resistance Low Medium High
Stability in liquid cultures Medium Medium High
Performance in long incubations Medium Medium High

Conclusion: Why Ticarcillin Supplement Remains the Preferred Selection Additive

Ticarcillin Supplement is a high-efficiency selection reagent providing consistent performance across cloning, expression, and molecular engineering workflows. Its enhanced stability, reduced satellite colony formation, and robust β-lactamase resistance make it a superior choice for plasmid maintenance in research environments.

Academic and government research infrastructures worldwide—including NIH-funded labs, NSF-supported programs, and major universities—continue to rely on Ticarcillin Supplement due to its reliability, reproducibility, and compatibility with modern cloning platforms.

(Aligned with Google indexing trends for biotech/e-commerce)

  • Ticarcillin sodium supplement

  • carboxypenicillin selection reagent

  • plasmid selection antibiotic

  • LB agar antibiotic additive

  • bacterial selection system

  • high-copy plasmid stability reagent

  • β-lactam research reagent

  • Ticarcillin for E. coli cloning

  • antibiotic supplement for microbial culture

  • lab-grade Ticarcillin powder

Cusabio Salmonella typhimurium Recombinant

Abstract

The HIV/AIDS epidemic continues to be a global health problem, especially in sub-Saharan Africa. Therefore, an effective HIV-1 vaccine is urgently needed to mitigate this ever-expanding problem. Since HIV-1 infects its host through the mucosal surface, a vaccine against the virus must elicit both mucosal and systemic immune responses. Oral attenuated recombinant Salmonella vaccines offer this potential to deliver HIV-1 antigens to the mucosal and systemic compartments of the immune system.

To date, a number of preclinical studies have been conducted, in which HIV-1 Gag, a highly conserved viral antigen possessing T- and B-cell epitopes, has been successfully delivered by recombinant Salmonella typhimurium vaccines, and in most cases, HIV-specific immune responses were induced. In this review, the potential use of Salmonella enterica serovar Typhimurium as a live vaccine vector for HIV-1 Gag is explored.

Keywords: Salmonella, vaccine, vector, HIV-1 Gag, immune response

Purity: >85% (SDS-PAGE)

Target Names: cheY

Uniprot No.: P0A2D5

Alternative names: cheY; STM1916; CheY chemotaxis protein

Species: Salmonella typhimurium (strain LT2 / SGSC1412 / ATCC 700720)

Expression Region: 2-129

Protein length: Total length of the mature protein

Label information

The following labels are available.

  • N-terminus His-tagged
  • Without tags
  • The type of label will be determined during the production process. If you have specified a tag type, let us know and we will develop the specified tag preferentially.

Form: Lyophilized powder

Buffer before lyophilization: Tris/PBS based buffer, 6% trehalose, pH 8.0

Reconstitution

We recommend that this vial be briefly centrifuged before opening to bring the contents to the bottom. Reconstitute protein in sterile deionized water at a concentration of 0.1-1.0 mg/mL. We recommend adding 5-50% glycerol (final concentration) and an aliquot for long-term storage at -20℃/-80℃. Our final default glycerol concentration is 50%. Customers could use it for reference.

Storage Conditions

Store at -20°C/-80°C upon receipt, need to be aliquoted for multiple uses. Avoid repeated cycles of freezing and thawing.

Shelf life

Shelf life is related to many factors, storage condition, buffer ingredients, storage temperature and the stability of the protein itself. Generally, the shelf life of the liquid form is 6 months at -20°C/-80°C. The shelf life of the lyophilized form is 12 months at -20°C/-80°C.

Delivery time

The delivery time may differ depending on the way or location of purchase, consult your local distributors for the specific delivery time.

Note: All of our proteins are shipped with regular blue ice packs by default. If you request shipping with dry ice, please contact us in advance and additional fees will be charged.

Notes: Repeated freezing and thawing is not recommended. Store working aliquots at 4°C for up to one week.

Cusabio Saccharomyces cerevisiae Recombinant

Introduction

The production of recombinant therapeutic proteins is one of the rapidly growing areas of molecular medicine and currently plays an important role in the treatment of various diseases. Yeasts are unicellular eukaryotic microbial host cells that offer unique advantages in the production of biopharmaceutical proteins. Yeasts are capable of robust growth on simple media, readily adapt to genetic modifications, and incorporate post-translational modifications typical of eukaryotes.

Saccharomyces cerevisiae Recombinant is a traditional baker’s yeast that has been used as an important host for the production of biopharmaceuticals; however, several unconventional yeast species, including Hansenula polymorpha, Pichia pastoris, and Yarrowia lipolytica, have gained increasing attention as alternative hosts for the industrial production of recombinant proteins. In this review, we address established and emerging genetic tools and host strains suitable for recombinant protein production in various yeast expression systems, with a particular focus on current efforts toward synthetic biology, approaches in the development of yeast cell factories. for the production of therapeutic recombinant proteins.

Polyketide synthases

In nature, polyketides are formed enzymatically by consecutive Claisen condensation reactions of short-chain acyl derivatives. At the biochemical level, polyketide assembly is very reminiscent of fatty acid biosynthesis, although it involves a greater variety of initiator and extender units. Furthermore, it shows greater flexibility in the reductive processing of these building blocks. Due to these peculiarities, polyketides exhibit enormous structural diversity, ranging from polyenes, polyethers and enediynes to macrolides, phenolic and polycyclic aromatic compounds.

The enzymes, which are responsible for the biosynthesis of these molecules, are called polyketide synthases (PKS). According to their architecture, they can be divided into three classes. Type I PKS are large, modularly organized proteins of microbial origin. They have multiple catalytic domains with specific functions. While most type I bacterial PKSs follow a logic of sequential assembly, their fungal counterparts tend to operate repetitively. The latter is also true for type II PKSs, which form monofunctional protein complexes. Until now, type II PKSs have only been found in a few prokaryotic groups, for example, in actinomycetes bacteria.

In contrast, type III PKSs represent the most widely distributed class of all PKSs with known members from bacteria, fungi, (micro)algae, and plants. Structurally, they are much smaller and less complex than the other two PKS classes. They consist of a homodimeric ketosynthase, which governs the entire assembly process, from substrate discrimination to chain elongation and product release. In the following, we will focus exclusively on the assembly mechanisms of type I PKS. Readers who wish to learn more about type II and type III PKS are referred to the reviews by Wang et al. and Shimizu et al.

Results and Discussion

Evaluation of target genes in protein secretion and retention.

Based on a list of mutated genes obtained from our previous study (18), genes involved in secretory and trafficking pathways (such as ECM3, EMC1, ERV29, GOS1, VPS5, TDA3, COG5, and CNS2), genes with similar functions appearing in Different strains (HDA2 and HDA3) and genes with a missense mutation of enriched GO terms (such as TAN1 from tRNA processing, PGM2 from carbohydrate metabolic process and PXA1 from lipid transport) were selected for evaluating its association with protein secretion and retention using single gene deletions.

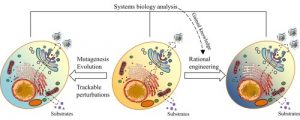
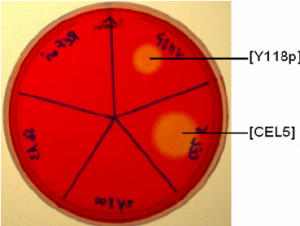
To allow an initial selection of these different targets, we used the BY4742 strain background for which a unique gene deletion library is available, but consistent with our previous study, we used amylase as the model protein. Amylase production varied in BY4742 strains with a single gene deletion; some had increased amylase secretion and some had reduced amylase secretion compared with the reference strain. In addition to changes in amylase yield, the intracellular amylase ratio was also found to be altered by gene deletion.

Cusabio Transport Recombinants

Abstract

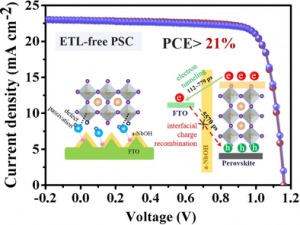
Solar cells using perovskite as a semiconductor pigment have recently attracted great interest due to their remarkable solar-to-electrical energy conversion efficiencies and ease of processing. In this direction, various device architectures and materials have been employed, and attempts have been made to elucidate the underlying operating principles. However, the factors that govern the performance of perovskite devices are still obscure.

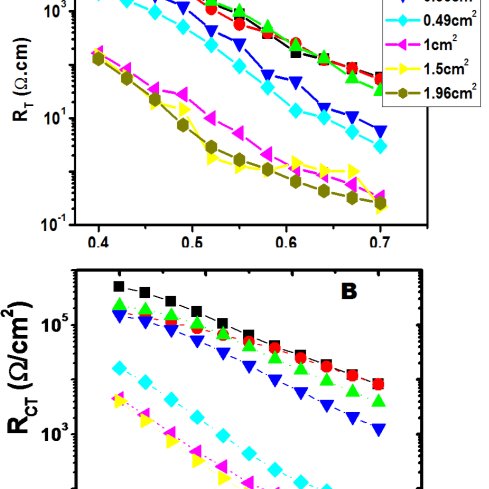
For example, interpretation of electrochemical impedance spectroscopy (EIS) is not straightforward and the complexity of equivalent circuits makes it difficult to identify transport and recombination mechanisms in devices, especially those that determine device performance. Here we carry out a complete and complementary characterization of perovskite solar cells using a series of small perturbation techniques: EIS and intensity-modulated photocurrent and photovoltage spectroscopy (IMPS/IMVS). Using IMPS allowed us to identify two transport times separated by 2 orders of magnitude and with opposite voltage dependencies.

For recombination, a good agreement was found between the lifetimes obtained by IMVS and EIS. The feature associated with recombination and charge accumulation in an impedance spectrum was experimentally identified through correlation with the IMVS response. This correlation paves the way to reconstruct the current-voltage curve using a continuity equation model for transport and recombination in the working device. The adopted methodology demonstrates that complementary techniques facilitate the interpretation of EIS results in perovskite solar cells, allowing us to identify transport recombination mechanisms and providing new insights into the steps that determine efficiency.

Purity: >85% (SDS-PAGE)

Destination Names: Mert

Uniprot No.: P13112

Alternative Names: merT; mercury transporter protein Mert; Mercury ion transport protein

Species: Serratia marcescens

Protein length: Partial

Label information

The following labels are available.

  • N-terminus His-tagged
  • Without tags
  • The type of label will be determined during the production process. If you have specified a tag type, let us know and we will develop the specified tag preferentially.

Form: Lyophilized powder

Buffer before lyophilization: Tris/PBS based buffer, 6% trehalose, pH 8.0

Reconstitution

We recommend that this vial be briefly centrifuged before opening to bring the contents to the bottom. Reconstitute protein in sterile deionized water at a concentration of 0.1-1.0 mg/mL. We recommend adding 5-50% glycerol (final concentration) and an aliquot for long-term storage at -20℃/-80℃. Our final default glycerol concentration is 50%. Customers could use it for reference.

Storage Conditions

Store at -20°C/-80°C upon receipt, need to be aliquoted for multiple uses. Avoid repeated cycles of freezing and thawing.

Shelf life

Shelf life is related to many factors, storage condition, buffer ingredients, storage temperature and the stability of the protein itself. Generally, the shelf life of the liquid form is 6 months at -20°C/-80°C. The shelf life of the lyophilized form is 12 months at -20°C/-80°C.

Delivery time

The delivery time may differ depending on the form or location of purchase, consult your local distributors for the specific delivery time.

Note: All of our proteins are shipped with regular blue ice packs by default. If you request shipping with dry ice, please contact us in advance and additional fees will be charged.

Notes: Repeated freezing and thawing is not recommended. Store working aliquots at 4°C for up to one week.

Freight transport and load recombination

Charge carrier transport and carrier recombination govern the operation of all electronic devices, including those that use organic semiconductors. Therefore, understanding charge transport and charge recombination in organic semiconductors is a prerequisite for successfully designing future high-performance organic electronic devices. In our group, we study the transport of charge carriers through the fabrication of field-effect transistors and what are known as single-carrier devices.

Understanding the energy of organic materials allows us to isolate either hole or electron transport by choosing electrode materials with the correct work functions relative to the boundary energy levels of a given organic compound. Analysis of the current-voltage characteristics of these devices provides information on how fast these charge carriers are transported through organic material and whether the organic material under investigation possesses the right properties to be used in high-performance organic solar cells. , field-effect transistors, or light-emitting diodes.

We employ a variety of techniques to understand recombination mechanisms in organic semiconductors. The study of double carrier devices allows us to investigate the process of recombination of holes with electrons. This process is a fundamental loss mechanism in organic solar cells, but it is essential for the operation of light-emitting diodes. Furthermore, we investigate recombination mechanisms by observing photoluminescence, electroluminescence, quantum efficiency, and impedance response of organic electronic devices as a function of temperature and excitation energy.

Analysis and Modelling of Large and Heterogeneous Populations of DNA Using a PCR-Based Method.

Analysis and Modelling of Large and Heterogeneous Populations of DNA Using a PCR-Based Method.

The research of populations of massive dimension and excessive variety is proscribed by the aptitude of gathering knowledge. Moreover, for a pool of people, every related to a distinctive attribute function, because the pool dimension grows, the potential interactions enhance exponentially, rapidly past the restrict of computation and experimental research. Herein, we current designs of DNA libraries with numerous variety. Using a facile analytic technique primarily based on actual time PCR, we are able to consider the range of a pool of DNA permitting terribly excessive heterogenicity (e.g. > 1 trillion).

We demonstrated that these DNA libraries can be utilized to mannequin heterogeneous populations, exhibiting capabilities corresponding to self-protection, appropriate for biased enlargement, and to evolve into amorphous constructions. The technique has proven the exceptional energy of parallel computing utilizing DNA, as it may well resemble an analogue pc and be utilized in selection-based biotechnology strategies, corresponding to DNA-encoded chemical libraries. As a chemical method to unravel issues historically for genetic and statistical evaluation, the strategy offers a fast and cost-efficient analysis of library variety for the intermediate steps by a choice course of.

Consistent variations amongst melting curves of PCR-amplified DNA fragments are handled by normalizing the relative fluorescence models (RFU) and performing a clustering evaluation, however statistically important variations amongst curves usually are not often decided. In the current research, an evaluation primarily based on useful knowledge evaluation (FDA) was applied to judge the existence of statistically important variations between normalized RFU curves obtained from PCR-HRM (high-resolution melting) evaluation by utilizing ANOVA for useful knowledge.

The effectiveness of the FDA technique was analyzed with knowledge from a set of samples of eight animal species of curiosity in meals evaluation, in addition to mixtures of DNA from these species, analyzed by PCR-HRM to distinguish them. The statistical technique described on this research has been demonstrated to be a sturdy and exact device to discriminate amongst melting curves derived from HRM evaluation. This technique has benefits over the present comparability strategies. PRACTICAL APPLICATION: As lengthy as meals fraud and mislabeling exist, new methods for species identification are wanted.

Rapid and Reliable One-Step ABO Genotyping Using Direct Real-Time Allele-Specific PCR and Melting Curve Analysis Without DNA Preparation.

ABO genotyping is a molecular diagnostic method necessary for transfusion and transplantation in medication, and human identification in forensic science. Because ABO genotyping are labor intensive and time consuming, the genotyping can’t be firstly used to resolve the serological ABO discrepancy in blood financial institution. For fast one-step ABO genotyping, we developed direct, real-time, allele-specific polymerase chain response (PCR), and melting curve evaluation (DRAM assay) with out DNA preparation. In DRAM assay, we used a particular PCR buffer for direct PCR, a fast RBC lysis buffer, white blood cells as template with out DNA preparation, allele-specific primers for discriminating three ABO alleles (261G/del, 796C/A, and 803G/C), and melting curve evaluation as a detection technique.

There was 100% concordance among the many outcomes of ABO genotyping by the DRAM assay, serologic typing, PCR-RFLP and PCR-direct sequencing of 96 venous blood samples. We have been capable of cut back the quantity of handbook steps to a few and the hands-on time to 12 min, in comparison with seven steps and roughly 40 min for standard ABO genotyping utilizing allele-specific PCR with purified DNA and agarose gel electrophoresis. We have established and validated the DRAM assay for fast and dependable one-step ABO genotyping in a closed system. The DRAM assay with an acceptable quantity of allele-specific primers may assist in resolving ABO discrepancies and ought to be helpful in scientific laboratory and blood financial institution.

Analysis and Modelling of Large and Heterogeneous Populations of DNA Using a PCR-Based Method.

Analyses of the genetic variety and inhabitants constructions of Histoplasma capsulatum scientific isolates from Mexico, Guatemala, Colombia and Argentina, utilizing a randomly amplified polymorphic DNAPCR assay.

We studied the genetic variety and the inhabitants construction of human isolates of Histoplasma capsulatum, the causative agent of histoplasmosis, utilizing a randomly amplified polymorphic DNA-polymerase chain response (RAPD-PCR) assay to determine associations with the geographic distribution of isolates from Mexico, Guatemala, Colombia and Argentina. The RAPD-PCR sample analyses revealed the genetic variety by estimating the proportion of polymorphic loci, efficient quantity of alleles, Shannon’s index and heterozygosity. Population construction was recognized by the index of affiliation (IA) take a look at. These knowledge contribute to the information on the molecular epidemiology of histoplasmosis in Latin America.
Thirty-seven isolates have been studied and clustered into three teams by the unweighted pair-group technique with arithmetic imply (UPGMA). Group I contained 5 subgroups primarily based on geographic origin. The consistency of the UPGMA dendrogram was estimated by the cophenetic correlation coefficient (CCCr = 0.94, P = 0.001). Isolates from Mexico and Colombia introduced larger genetic variety than isolates from Argentina. Isolates from Guatemala grouped along with the reference strains from the United States of America and Panama. The IA values recommend the presence of a clonal inhabitants construction within the Argentinian H. capsulatum isolates and additionally validate the presence of recombining populations within the Colombian and Mexican isolates.

Mouse C57 Salivary gland, Submandibular cDNA-Random Primer

MD-317-C57-RH 30 reactions
EUR 280

Mouse CD1 Salivary gland, Submandibular cDNA-Random Primer

MD-317-HR 30 reactions
EUR 243

Glandular kallikrein-3, submandibular

AP84287 1mg
EUR 2640

Submandibular glandular kallikrein-9

AP84804 1mg
EUR 2640

Submandibular Gland Renin Mouse, Antibody

GWB-DDA1F9 0.2 ml Ask for price

Submandibular Gland Renin antibody (Mouse)

MBS530878-02mL 0.2mL
EUR 660

Submandibular Gland Renin antibody (Mouse)

MBS530878-5x02mL 5x0.2mL
EUR 2825

Submandibular Gland Renin antibody (Mouse)

10R-S119a 200 ul Ask for price

Smgc (Submandibular Gland Protein C, Muc19)

MBS6008748-01mg 0.1(mg
EUR 655

Smgc (Submandibular Gland Protein C, Muc19)

MBS6008748-5x01mg 5x0.1mg
EUR 2800

Rat Submandibular Epithelial Primary Cells

CC7F322 5x 10^5 Cells/Vial Ask for price

Glandular kallikrein-7, submandibular/renal

AP84634 1mg
EUR 2640

Immortalized Human Submandibular Gland Cells

T0732 1x10^6 cells / 1.0 ml
EUR 2750

Mouse Submandibular Epithelial Primary Cells

CC7F529 5x 10^5 Cells/Vial Ask for price

Muc10 (untagged) - Mouse mucin 10, submandibular gland salivary mucin (cDNA clone MGC:25326 IMAGE:4924369), (10ug)

MC218203 10 µg Ask for price

Muc10 (untagged) - Mouse mucin 10, submandibular gland salivary mucin (cDNA clone MGC:29112 IMAGE:4166946), (10ug)

MC206844 10 µg Ask for price

Muc10 (GFP-tagged) - Mouse mucin 10, submandibular gland salivary mucin (cDNA clone MGC:25326 IMAGE:4924369)

MG203492 10 µg Ask for price

Muc10 (GFP-tagged) - Mouse mucin 10, submandibular gland salivary mucin (cDNA clone MGC:29112 IMAGE:4166946)

MG201463 10 µg Ask for price

Rabbit Submandibular Epithelial Primary Cells

CC7F730 5x 10^5 Cells/Vial Ask for price

Muc10 (Myc-DDK-tagged) - Mouse mucin 10, submandibular gland salivary mucin (cDNA clone MGC:25326 IMAGE:4924369)

MR203492 10 µg Ask for price

Muc10 (Myc-DDK-tagged) - Mouse mucin 10, submandibular gland salivary mucin (cDNA clone MGC:29112 IMAGE:4166946)

MR201463 10 µg Ask for price

Mouse Submandibular gland protein C, Muc19 ELISA KIT

ELI-35955m 96 Tests
EUR 1038

Glandular Kallikrein-3, Submandibular (KLK3) Antibody

abx173227-100l 100 µl
EUR 775

Glandular Kallikrein-3, Submandibular (KLK3) Antibody

abx173227-1ml 1 ml Ask for price

Glandular Kallikrein-3, Submandibular (KLK3) Antibody

abx173227-200l 200 µl Ask for price

Glandular Kallikrein-3, Submandibular (KLK3) Antibody

abx177249-1096tests 10 × 96 tests
EUR 725

Glandular Kallikrein-3, Submandibular (KLK3) Antibody

abx177249-596tests 5 × 96 tests
EUR 337.5

Glandular Kallikrein-3, Submandibular (KLK3) Antibody

abx177249-96tests 96 tests
EUR 262.5

Rat Submandibular glandular kallikrein-9 ELISA Kit

EK1729 96 tests
EUR 599

Rat Submandibular glandular kallikrein-9 ELISA Kit

MBS2884824-10x96StripWells 10x96-Strip-Wells
EUR 4080

Rat Submandibular glandular kallikrein-9 ELISA Kit

MBS2884824-48StripWells 48-Strip-Wells
EUR 390

Rat Submandibular glandular kallikrein-9 ELISA Kit

MBS2884824-5x96StripWells 5x96-Strip-Wells
EUR 2220

Rat Submandibular glandular kallikrein-9 ELISA Kit

MBS2884824-96StripWells 96-Strip-Wells
EUR 520

Rat Glandular kallikrein-3, submandibular ELISA Kit

MBS2880416-10x96StripWells 10x96-Strip-Wells
EUR 4080

Rat Glandular kallikrein-3, submandibular ELISA Kit

MBS2880416-48StripWells 48-Strip-Wells
EUR 390

Rat Glandular kallikrein-3, submandibular ELISA Kit

MBS2880416-5x96StripWells 5x96-Strip-Wells
EUR 2220

Rat Glandular kallikrein-3, submandibular ELISA Kit

MBS2880416-96StripWells 96-Strip-Wells
EUR 520

Rat Submandibular glandular kallikrein-9 ELISA Kit

MBS764653-10x96StripWells 10x96-Strip-Wells
EUR 3900

Rat Submandibular glandular kallikrein-9 ELISA Kit

MBS764653-48StripWells 48-Strip-Wells
EUR 340

Rat Submandibular glandular kallikrein-9 ELISA Kit

MBS764653-5x96StripWells 5x96-Strip-Wells
EUR 2045

Rat Submandibular glandular kallikrein-9 ELISA Kit

MBS764653-96StripWells 96-Strip-Wells
EUR 455

Rat Submandibular glandular kallikrein-9 ELISA Kit

MBS9425589-5x96Tests 5x96Tests
EUR 2820

Rat Submandibular glandular kallikrein-9 ELISA Kit

MBS9425589-96Tests 96Tests
EUR 615

Rat Glandular kallikrein-7, submandibular/renal (Klk7)

1-CSB-EP012458RA
  • Ask for price
  • Ask for price
  • Ask for price
  • Ask for price
  • Ask for price
  • Ask for price
  • 10ug
  • 50ug
  • 100ug
  • 200ug
  • 500ug
  • 1MG
Description: Recombinant Rat Glandular kallikrein-7, submandibular/renal(Klk7) expressed in E.coli

Recombinant Mouse Submandibular gland protein C (Muc19)

MBS1469522-002mgBaculovirus 0.02mg(Baculovirus)
EUR 1565

Recombinant Mouse Submandibular gland protein C (Muc19)

MBS1469522-002mgEColi 0.02mg(E-Coli)
EUR 1290

Recombinant Mouse Submandibular gland protein C (Muc19)

MBS1469522-002mgYeast 0.02mg(Yeast)
EUR 1325

Recombinant Mouse Submandibular gland protein C (Muc19)

MBS1469522-01mgEColi 0.1mg(E-Coli)
EUR 1555

Recombinant Mouse Submandibular gland protein C (Muc19)

MBS1469522-01mgYeast 0.1mg(Yeast)
EUR 1555

Rat Glandular Kallikrein-3, Submandibular (KLK3) Protein

abx654096-1g 1 µg
EUR 1800

Rat Glandular Kallikrein-3, Submandibular (KLK3) Protein

abx654096-50g 50 µg Ask for price

Rat Glandular Kallikrein-3, Submandibular (KLK3) Protein

abx654096-5g 5 µg
EUR 4525

Rat Glandular Kallikrein-3, Submandibular (KLK3) CLIA Kit

abx195945-96tests 96 tests
EUR 618.75

ELISA Kit for Rat Glandular kallikrein-3, submandibular

E0151r 96T
EUR 387.4

Rat Glandular Kallikrein-3, Submandibular (KLK3) CLIA Kit

20-abx491149
  • Ask for price
  • Ask for price
  • Ask for price
  • 96 tests
  • 5 × 96 tests
  • 10 × 96 tests

ELISA Kit for Rat Submandibular glandular kallikrein-9

E0408r 96T
EUR 387.4

Rat Submandibular glandular kallikrein-9 (Klk9) ELISA Kit

abx256273-96tests 96 tests
EUR 801.6

Rat Glandular Kallikrein-3, Submandibular (KLK3) ELISA Kit

abx155753-100g 100 µg
EUR 6075

Rat Glandular Kallikrein-3, Submandibular (KLK3) ELISA Kit

abx155753-10g 10 µg
EUR 675

Rat Glandular Kallikrein-3, Submandibular (KLK3) ELISA Kit

abx155753-50g 50 µg
EUR 3212.5

Rat Klk9/ Submandibular glandular kallikrein-9 ELISA Kit

E0548Ra 1 Kit
EUR 557
Description: Klk-9,Klks3,KLK-S3,S3 kallikrein,Submandibular enzymatic vasoconstrictor,Tissue kallikrein,SEV

Rat Klk9(Submandibular glandular kallikrein-9) ELISA Kit

EKF58847-48T 48T
EUR 396.9

Rat Klk9(Submandibular glandular kallikrein-9) ELISA Kit

EKF58847-5x96T 5x96T
EUR 2693.25

Rat Klk9(Submandibular glandular kallikrein-9) ELISA Kit

EKF58847-96T 96T
EUR 567

Rat Klk9(Submandibular glandular kallikrein-9) ELISA Kit

ER0295 96T
EUR 681.12
Description: Method of detection: Double Antibody, Sandwich ELISA;Reacts with: Rattus;Sensitivity: 18.75pg/ml

Rat Glandular kallikrein-7, submandibular/renal ELISA Kit

MBS2886220-10x96StripWells 10x96-Strip-Wells
EUR 4080

Rat Glandular kallikrein-7, submandibular/renal ELISA Kit

MBS2886220-48StripWells 48-Strip-Wells
EUR 390

Rat Glandular kallikrein-7, submandibular/renal ELISA Kit

MBS2886220-5x96StripWells 5x96-Strip-Wells
EUR 2220

Rat Glandular kallikrein-7, submandibular/renal ELISA Kit

MBS2886220-96StripWells 96-Strip-Wells
EUR 520

Lenti ORF clone of Muc10 (mGFP-tagged) - Mouse mucin 10, submandibular gland salivary mucin (cDNA clone MGC:25326 IMAGE:4924369)

MR203492L4 10 µg Ask for price

Lenti ORF clone of Muc10 (mGFP-tagged) - Mouse mucin 10, submandibular gland salivary mucin (cDNA clone MGC:29112 IMAGE:4166946)

MR201463L4 10 µg Ask for price

Recombinant Rat Submandibular glandular kallikrein-9 (Klk9)

MBS964954-002mgBaculovirus 0.02mg(Baculovirus)
EUR 1120

Recombinant Rat Submandibular glandular kallikrein-9 (Klk9)

MBS964954-002mgEColi 0.02mg(E-Coli)
EUR 745

Recombinant Rat Submandibular glandular kallikrein-9 (Klk9)

MBS964954-002mgYeast 0.02mg(Yeast)
EUR 905

Recombinant Rat Submandibular glandular kallikrein-9 (Klk9)

MBS964954-01mgEColi 0.1mg(E-Coli)
EUR 890

Recombinant Rat Submandibular glandular kallikrein-9 (Klk9)

MBS964954-01mgYeast 0.1mg(Yeast)
EUR 1060

Recombinant Rat Glandular kallikrein-3, submandibular (Klk3)

MBS951666-002mgBaculovirus 0.02mg(Baculovirus)
EUR 1105

Recombinant Rat Glandular kallikrein-3, submandibular (Klk3)

MBS951666-002mgEColi 0.02mg(E-Coli)
EUR 700

Recombinant Rat Glandular kallikrein-3, submandibular (Klk3)

MBS951666-002mgYeast 0.02mg(Yeast)
EUR 860

Recombinant Rat Glandular kallikrein-3, submandibular (Klk3)

MBS951666-01mgEColi 0.1mg(E-Coli)
EUR 825

Recombinant Rat Glandular kallikrein-3, submandibular (Klk3)

MBS951666-01mgYeast 0.1mg(Yeast)
EUR 1010

Mouse 16.5 kDa submandibular gland glycoprotein, Spt1 ELISA KIT

ELI-29687m 96 Tests
EUR 1038

Smgc (untagged) - Mouse submandibular gland protein C (Smgc), (10ug)

MC221197 10 µg Ask for price

Recombinant Rat Glandular kallikrein-7, submandibular/renal

MBS949033-002mgEColi 0.02mg(E-Coli)
EUR 320

Recombinant Rat Glandular kallikrein-7, submandibular/renal

MBS949033-01mgEColi 0.1mg(E-Coli)
EUR 520

Recombinant Rat Glandular kallikrein-7, submandibular/renal

MBS949033-1mgEColi 1mg(E-Coli)
EUR 1925

Recombinant Rat Glandular kallikrein-7, submandibular/renal

MBS949033-5x1mgEColi 5x1mg(E-Coli)
EUR 8405

Recombinant Rat Glandular kallikrein-7, submandibular/renal

MBS9420391-002mg 0.02mg
EUR 380

Recombinant Rat Glandular kallikrein-7, submandibular/renal

MBS9420391-01mg 0.1mg
EUR 650

Recombinant Rat Glandular kallikrein-7, submandibular/renal

MBS9420391-1mg 1mg
EUR 2525

Recombinant Rat Glandular kallikrein-7, submandibular/renal

MBS9420391-5x1mg 5x1mg
EUR 11205

Lenti ORF clone of Muc10 (Myc-DDK-tagged) - Mouse mucin 10, submandibular gland salivary mucin (cDNA clone MGC:25326 IMAGE:4924369)

MR203492L3 10 µg Ask for price

Lenti ORF clone of Muc10 (Myc-DDK-tagged) - Mouse mucin 10, submandibular gland salivary mucin (cDNA clone MGC:29112 IMAGE:4166946)

MR201463L3 10 µg Ask for price

Mouse 16.5 kDa submandibular gland glycoprotein (MUCL2) ELISA Kit

abx545538-96tests 96 tests
EUR 687.5

Rat Submandibular gland secretory Glx- rich protein CA, Grpca EL

ELI-27901r 96 Tests
EUR 1063.2

Smgc (untagged ORF) - Rat submandibular gland protein C (Smgc), (10 ug)

RN212008 10 µg Ask for price

ELISA Kit for Rat Glandular kallikrein-7, submandibular/renal

E1910r 96T
EUR 387.4

Rat Glandular kallikrein- 7, submandibular/renal, Klk7 ELISA KIT

ELI-06139r 96 Tests
EUR 1063.2

Double-headed protease inhibitor, submandibular gland Antibody

CSB-PA360611ZA01FQF-02mg 0.2mg Ask for price
Description: Recombinant Canis lupus familiaris Double-headed protease inhibitor, submandibular gland protein

Double-headed protease inhibitor, submandibular gland Antibody

CSB-PA360611ZA01FQF-10mg 10mg Ask for price
Description: Recombinant Canis lupus familiaris Double-headed protease inhibitor, submandibular gland protein

Smgc (GFP-tagged) - Mouse submandibular gland protein C (Smgc), (10ug)

MG219211 10 µg Ask for price

Smgc (Myc-DDK-tagged) - Mouse submandibular gland protein C (Smgc)

MR219211 10 µg Ask for price

Recombinant Rat Glandular kallikrein-7, submandibular/renal (Klk7)

CSB-EP012458RA 1553 mg Ask for price

Recombinant Rat Glandular kallikrein-7, submandibular/renal (Klk7)

CSB-EP012458RA-20ug 20ug Ask for price
Description: 25-261aa

Recombinant Rat Glandular kallikrein-7, submandibular/renal(Klk7)

AP70475 1mg
EUR 2826

Klk9 ELISA Kit| Rat Submandibular glandular kallikrein-9 ELISA K

EF017179 96 Tests
EUR 826.8

Lenti ORF particles, Muc10 (GFP-tagged) - Mouse mucin 10, submandibular gland salivary mucin (cDNA clone MGC:25326 IMAGE:4924369), 200ul, >10^7 T

MR203492L4V 200 µl Ask for price

Lenti ORF particles, Muc10 (GFP-tagged) - Mouse mucin 10, submandibular gland salivary mucin (cDNA clone MGC:29112 IMAGE:4166946), 200ul, >10^7 T

MR201463L4V 200 µl Ask for price

Recombinant Rat Glandular kallikrein-12, submandibular/renal (Klk12)

MBS718166-002mgBaculovirus 0.02mg(Baculovirus)
EUR 1120

Recombinant Rat Glandular kallikrein-12, submandibular/renal (Klk12)

MBS718166-002mgEColi 0.02mg(E-Coli)
EUR 745

Recombinant Rat Glandular kallikrein-12, submandibular/renal (Klk12)

MBS718166-002mgYeast 0.02mg(Yeast)
EUR 905

Recombinant Rat Glandular kallikrein-12, submandibular/renal (Klk12)

MBS718166-01mgEColi 0.1mg(E-Coli)
EUR 890

Recombinant Rat Glandular kallikrein-12, submandibular/renal (Klk12)

MBS718166-01mgYeast 0.1mg(Yeast)
EUR 1060

Recombinant Dog Double-headed protease inhibitor, submandibular gland

CSB-EP360611DO 7287 mg Ask for price

Recombinant Dog Double-headed protease inhibitor, submandibular gland

CSB-EP360611DO-100ug 100ug Ask for price
Description: 1-115aa

Recombinant Dog Double-headed protease inhibitor, submandibular gland

CSB-EP360611DO-1mg 1mg Ask for price
Description: 1-115aa

Recombinant Dog Double-headed protease inhibitor, submandibular gland

CSB-EP360611DO-20ug 20ug Ask for price
Description: 1-115aa

Recombinant Dog Double-headed protease inhibitor, submandibular gland

MBS1175326-002mgEColi 0.02mg(E-Coli)
EUR 375

Recombinant Dog Double-headed protease inhibitor, submandibular gland

MBS1175326-01mgEColi 0.1mg(E-Coli)
EUR 635

Recombinant Dog Double-headed protease inhibitor, submandibular gland

MBS1175326-1mgEColi 1mg(E-Coli)
EUR 1925

Recombinant Dog Double-headed protease inhibitor, submandibular gland

MBS1175326-5x1mgEColi 5x1mg(E-Coli)
EUR 8405

Recombinant Cat Double-headed protease inhibitor, submandibular gland

MBS1019831-002mgBaculovirus 0.02mg(Baculovirus)
EUR 1035

Recombinant Cat Double-headed protease inhibitor, submandibular gland

MBS1019831-002mgEColi 0.02mg(E-Coli)
EUR 610

Recombinant Cat Double-headed protease inhibitor, submandibular gland

MBS1019831-002mgYeast 0.02mg(Yeast)
EUR 785

Recombinant Cat Double-headed protease inhibitor, submandibular gland

MBS1019831-01mgEColi 0.1mg(E-Coli)
EUR 710

Recombinant Cat Double-headed protease inhibitor, submandibular gland

MBS1019831-01mgYeast 0.1mg(Yeast)
EUR 920

Recombinant Dog Double-headed protease inhibitor, submandibular gland

RPC27316-100ug 100ug
EUR 801.9

Recombinant Dog Double-headed protease inhibitor, submandibular gland

RPC27316-1mg 1mg
EUR 2885.2

Recombinant Dog Double-headed protease inhibitor, submandibular gland

RPC27316-20ug 20ug
EUR 448.1

Smgc (Myc-DDK-tagged ORF) - Rat submandibular gland protein C (Smgc), (10 ug)

RR212008 10 µg Ask for price

Rat Submandibular gland secretory Glx-rich protein CA (GRPCA) ELISA Kit

abx526301-96tests 96 tests
EUR 687.5

Lenti ORF particles, Muc10 (Myc-DDK-tagged) - Mouse mucin 10, submandibular gland salivary mucin (cDNA clone MGC:25326 IMAGE:4924369), 200ul, >10

MR203492L3V 200 µl Ask for price

Lenti ORF particles, Muc10 (Myc-DDK-tagged) - Mouse mucin 10, submandibular gland salivary mucin (cDNA clone MGC:29112 IMAGE:4166946), 200ul, >10

MR201463L3V 200 µl Ask for price

Recombinant Rat Submandibular gland secretory Glx-rich protein CB (Grpcb)

CSB-YP357398RAa0 10597 mg Ask for price

Recombinant Rat Submandibular gland secretory Glx-rich protein CB (Grpcb)

CSB-YP357398RAa0-100ug 100ug Ask for price
Description: 19-247aa

Recombinant Rat Submandibular gland secretory Glx-rich protein CB (Grpcb)

CSB-YP357398RAa0-1mg 1mg Ask for price
Description: 19-247aa

Recombinant Rat Submandibular gland secretory Glx-rich protein CB (Grpcb)

CSB-YP357398RAa0-20ug 20ug Ask for price
Description: 19-247aa

Recombinant Rat Submandibular gland secretory Glx-rich protein CA (Grpca)

MBS1251977-002mgBaculovirus 0.02mg(Baculovirus)
EUR 1120

Recombinant Rat Submandibular gland secretory Glx-rich protein CA (Grpca)

MBS1251977-002mgEColi 0.02mg(E-Coli)
EUR 735

Recombinant Rat Submandibular gland secretory Glx-rich protein CA (Grpca)

MBS1251977-002mgYeast 0.02mg(Yeast)
EUR 900

Recombinant Rat Submandibular gland secretory Glx-rich protein CA (Grpca)

MBS1251977-01mgEColi 0.1mg(E-Coli)
EUR 880

Recombinant Rat Submandibular gland secretory Glx-rich protein CA (Grpca)

MBS1251977-01mgYeast 0.1mg(Yeast)
EUR 1055

Bpifa2f (untagged ORF) - Rat neonatal submandibular gland protein B (Smgb), (10 ug)

RN212284 10 µg Ask for price

Recombinant Feline Double-Headed Protease Inhibitor, Submandibular Gland

AP2C171
  • Ask for price
  • Ask for price
  • Ask for price
  • 1 mg
  • 100 µg
  • 20 µg

Prol1 (untagged ORF) - Rat mucin 10, submandibular gland salivary mucin (Muc10), (10 ug)

RN215454 10 µg Ask for price

Recombinant Meles meles Double-headed protease inhibitor, submandibular gland

MBS1231704-002mgBaculovirus 0.02mg(Baculovirus)
EUR 1045

Recombinant Meles meles Double-headed protease inhibitor, submandibular gland

MBS1231704-002mgEColi 0.02mg(E-Coli)
EUR 625

Recombinant Meles meles Double-headed protease inhibitor, submandibular gland

MBS1231704-002mgYeast 0.02mg(Yeast)
EUR 800

Recombinant Meles meles Double-headed protease inhibitor, submandibular gland

MBS1231704-01mgEColi 0.1mg(E-Coli)
EUR 725

Recombinant Meles meles Double-headed protease inhibitor, submandibular gland

MBS1231704-01mgYeast 0.1mg(Yeast)
EUR 935

Recombinant Uncia uncia Double-headed protease inhibitor, submandibular gland

MBS1028252-002mgBaculovirus 0.02mg(Baculovirus)
EUR 1045

Recombinant Uncia uncia Double-headed protease inhibitor, submandibular gland

MBS1028252-002mgEColi 0.02mg(E-Coli)
EUR 625

Recombinant Uncia uncia Double-headed protease inhibitor, submandibular gland

MBS1028252-002mgYeast 0.02mg(Yeast)
EUR 800
Decoding DNA labels by melting curve analysis using real-time PCR.

Decoding DNA labels by melting curve analysis using real-time PCR.

Synthetic DNA has been used as an authentication code for a various variety of purposes. However, current decoding approaches are primarily based on both DNA sequencing or the willpower of DNA size variations. Here, we current a easy different protocol for labeling totally different objects using a small variety of brief DNA sequences that differ of their melting factors. Code amplification and decoding will be carried out in two steps using quantitative PCR (qPCR). To acquire a DNA barcode with excessive complexity, we outlined Eight template teams, every having four totally different DNA templates, yielding 158 (>2.5 billion) combos of various particular person melting temperature (Tm) values and corresponding ID codes.

The reproducibility and specificity of the decoding was confirmed by using probably the most advanced template combination, which had 32 totally different merchandise in Eight teams with totally different Tm values. The industrial applicability of our protocol was additionally demonstrated by labeling a drone with an oil-based paint containing a predefined DNA code, which was then efficiently decoded. The methodology introduced right here consists of a easy code system primarily based on a small variety of artificial DNA sequences and a cheap, fast decoding protocol using a couple of qPCR reactions, enabling a variety of authentication purposes.

Current research investigated the anti-mosquito potential of Achyranthes aspera towards the dengue vector, Aedes aegypti. The stems and leaves of A. aspera have been extracted in hexane and evaluated for his or her toxicity towards early fourth instars of A. aegypti. The larvicidal efficacy of the extract was validated as per WHO protocol. The mortality counts have been made after 24 h and LC values have been calculated at totally different ranges. No important variations in cfDNA concentrations have been detected between numerous time factors of as much as 24 h till centrifugation.

The antagonistic affect of extracts was additionally explored on the larval genomic DNA. The larvae have been uncovered to extracts at LC50 ranges and the alterations in g-DNA was evaluated via RAPD-PCR method using three random primers; MA-09, MA-12 and MA-26. Our investigations ascertained the larvicidal efficacy of each the leaf and stem extracts of A. aspera leading to respective LC50 values of 0.068 and 0.082 mg/mL. The extracts additionally precipitated variable genotoxic results with important adjustments within the RAPD profiles.

Digital PCR analysis of circulating tumor DNA: a biomarker for chondrosarcoma prognosis, prognostication, and residual illness detection.

Conventional chondrosarcoma is the most typical main bone tumor in adults. Prognosis corresponds with tumor grade however stays variable, particularly for people with grade (G) II illness. There are at the moment no biomarkers out there for monitoring or prognostication of chondrosarcoma. Circulating tumor DNA (ctDNA) has lately emerged as a promising biomarker for a broad vary of tumor sorts. To date, little has been carried out to review the presence of ctDNA and its potential utility within the administration of sarcomas, together with chondrosarcoma.

In this research, we’ve assessed ctDNA ranges in a cohort of 71 sufferers, 32 with sarcoma, together with 29 people with central chondrosarcoma (CS) and 39 with domestically aggressive and benign bone and gentle tissue tumors, using digital PCR. In sufferers with CS, ctDNA was detected in pretreatment samples in 14/29 sufferers, which confirmed clear correlation with tumor grade as demonstrated by the detection of ctDNA in all sufferers with GIII and dedifferentiated illness (n = 6) and in 8/17 sufferers with GII illness, however by no means related to GI CS. Notably detection of ctDNA preoperatively in GII illness was related to a poor final result.

A complete of 14 sufferers with CS had ctDNA ranges assessed at a number of time factors and in most sufferers there was a transparent discount following surgical elimination. This analysis lays the inspiration for bigger research to evaluate the utility of ctDNA for chondrosarcoma prognosis, prognostication, early detection of residual illness and monitoring illness development. DdPCR outcomes on cfDNA are extremely depending on a number of elements throughout preanalytical pattern workup, which have to be addressed through the growth of this diagnostic software for most cancers diagnostics sooner or later.

Decoding DNA labels by melting curve analysis using real-time PCR.

Preanalytical blood pattern workup for cell-free DNA analysis using Droplet Digital PCR for future molecular most cancers diagnostics.

In present molecular most cancers diagnostics, using blood samples of most cancers sufferers for the detection of genetic alterations in plasma (cell-free) circulating tumor DNA (ctDNA) is an rising observe. Since ctDNA ranges in blood are low, extremely delicate Droplet Digital PCR (ddPCR) can be utilized for detecting uncommon mutational targets. In order to carry out ddPCR on blood samples, a standardized process for processing and analyzing blood samples is critical to facilitate implementation into scientific observe. Therefore, we assessed the technical pattern workup process for ddPCR on blood plasma samples.

Bovine Uterus Genomic DNA

BG-411 0.1mg
EUR 177

Equine Uterus Genomic DNA

GE-411 0.1mg
EUR 210

Rabbit Uterus Genomic DNA

TG-411 0.1mg
EUR 177

Chicken Uterus Genomic DNA

GC-411 0.1mg
EUR 177

Hamster Uterus Genomic DNA

GA-411 0.1mg
EUR 177

Mini Pig Uterus Genomic DNA

GN-411 0.1mg
EUR 210

Guinea Pig Uterus Genomic DNA

GG-411 0.1mg
EUR 177

Monkey Rhesus Uterus Genomic DNA

UG-411 0.1mg
EUR 210

Monkey Cynomolgus Uterus Genomic DNA

KG-411 0.1mg
EUR 210

FFPE Genomic DNA - Human Tumor Tissue: Uterus

D2235274 2 ug
EUR 811.3

Genomic DNA - Lupus: Uterus, from a single donor

D1236274Lup 50 ug
EUR 426.3

Tissue, Genomic DNA, Human Tumor, Uterus Tumor, BioGenomics

MBS654573-005mg 0.05mg
EUR 715

Tissue, Genomic DNA, Human Tumor, Uterus Tumor, BioGenomics

MBS654573-5x005mg 5x0.05mg
EUR 3075

Tissue, Genomic DNA, Human Adult Normal, Uterus, BioGenomics

MBS654378-01mg 0.1mg
EUR 575

Tissue, Genomic DNA, Human Adult Normal, Uterus, BioGenomics

MBS654378-5x01mg 5x0.1mg
EUR 2440

Tissue, Genomic DNA, Human Disease, Lupus, Uterus, BioGenomics

MBS654466-005mg 0.05mg
EUR 725

Tissue, Genomic DNA, Human Disease, Lupus, Uterus, BioGenomics

MBS654466-5x005mg 5x0.05mg
EUR 3115

Tissue, Genomic DNA, Human Adult Normal, Uterus, Cervix, BioGenomics

MBS654541-01mg 0.1mg
EUR 575

Tissue, Genomic DNA, Human Adult Normal, Uterus, Cervix, BioGenomics

MBS654541-5x01mg 5x0.1mg
EUR 2440

Genomic DNA - Human Tumor Tissue: Uterus Tumor, from a single donor

D1235274 50 ug
EUR 413

Genomic DNA - Human Adult Normal Tissue: Uterus, from a single donor

D1234274 100 ug
EUR 241.5

Genomic DNA - Human Adult Normal Tissue: Uterus: Cervix, from a single donor

D1234275 100 ug
EUR 241.5

Mouse Skin Genomic DNA

MG-101 0.1mg
EUR 177

Mouse Lung Genomic DNA

MG-601 0.1mg
EUR 177

Mouse Nudes Genomic DNA

GMN-150 0.1mg
EUR 177

Mouse Scids Genomic DNA

GMS-150 0.1mg
EUR 177

Mouse Brain Genomic DNA

MG-201 0.1mg
EUR 177

Mouse Colon Genomic DNA

MG-311 0.1mg
EUR 177

Mouse Liver Genomic DNA

MG-314 0.1mg
EUR 177

Mouse Ovary Genomic DNA

MG-406 0.05mg
EUR 177

Mouse Heart Genomic DNA

MG-801 0.1mg
EUR 177

Mouse Testis Genomic DNA

MG-401 0.05mg
EUR 177

Mouse Spleen Genomic DNA

MG-701 0.1mg
EUR 177

Mouse Kidney Genomic DNA

MG-901 0.1mg
EUR 177

Mouse Stomach Genomic DNA

MG-302 0.1mg
EUR 177

Mouse Pancreas Genomic DNA

MG-313 0.1mg
EUR 177

Mouse Placenta Genomic DNA

MG-413 0.1mg
EUR 177

Mouse Esophagus Genomic DNA

MG-301 0.05mg
EUR 177

Mouse Intestine Genomic DNA

MG-306 0.1mg
EUR 177

Mouse C57 Skin Genomic DNA

MG-101-C57 0.025mg
EUR 210

Mouse C57 Lung Genomic DNA

MG-601-C57 0.1mg
EUR 210

Mouse C57 Brain Genomic DNA

MG-201-C57 0.05mg
EUR 210

Mouse C57 Colon Genomic DNA

MG-311-C57 0.1mg
EUR 210

Mouse C57 Liver Genomic DNA

MG-314-C57 0.1mg
EUR 210

Mouse C57 Heart Genomic DNA

MG-801-C57 0.025mg
EUR 210

Mouse C57 Spleen Genomic DNA

MG-701-C57 0.1mg
EUR 210

Mouse C57 Kidney Genomic DNA

MG-901-C57 0.1mg
EUR 210

Mouse C57 Stomach Genomic DNA

MG-302-C57 0.1mg
EUR 210

Control Genomic DNA - Mouse Male

D1334999-G01 100 ug
EUR 143.85

Mouse C57 Pancreas Genomic DNA

MG-313-C57 0.1mg
EUR 210

Mouse C57 Placenta Genomic DNA

MG-413-C57 0.025mg
EUR 210

Mouse C57 Intestine Genomic DNA

MG-306-C57 0.1mg
EUR 210

Control Genomic DNA - Mouse Female

D1334999-G02 100 ug
EUR 143.85

Mouse Skeletal Muscles Genomic DNA

MG-102 0.1mg
EUR 177

Mouse BALB/C Genomic DNA, Male

GMB-150M 0.1mg
EUR 177

Mouse ICR (CD1) Genomic DNA, Male

GMI-150M 0.1mg
EUR 177

Mouse C57BL/6J Genomic DNA, Male

GMC-150M 0.1mg
EUR 177

Mouse BALB/C Genomic DNA, Female

GMB-150F 0.1mg
EUR 177

Mouse ICR (CD1) Genomic DNA, Female

GMI-150F 0.1mg
EUR 177

Mouse C57BL/6J Genomic DNA, Female

GMC-150F 0.1mg
EUR 177

Genomic DNA - Mouse Normal Tissue: Lung

D1334152 100 ug
EUR 241.5

Mouse Swiss Webster Genomic DNA, Male

GMW-150M 0.1mg
EUR 177

Genomic DNA - Mouse Normal Tissue: Brain

D1334035 100 ug
EUR 241.5

Genomic DNA - Mouse Normal Tissue: Heart

D1334122 100 ug
EUR 241.5

Genomic DNA - Mouse Normal Tissue: Liver

D1334149 100 ug
EUR 241.5

Mouse Uterus, match set of RNA, DNA, Protein

MS-411-RDP 20µg/20µg/100µg
EUR 422

Genomic DNA - Mouse Normal Tissue: Kidney

D1334142 100 ug
EUR 241.5

Genomic DNA - Mouse Normal Tissue: Spleen

D1334246 100 ug
EUR 241.5

Mouse C57 Skeletal Muscles Genomic DNA

MG-102-C57 0.025mg
EUR 210

Genomic DNA - Mouse Normal Tissue: Stomach

D1334248 100 ug
EUR 241.5

Mouse Tail Genomic DNA Extraction Kit(250)

M9100-250 250 prep
EUR 385

Genomic DNA - Mouse Normal Tissue: Skeletal Muscle

D1334171 100 ug
EUR 241.5

Genomic DNA - Mouse Normal Tissue: Small Intestine

D1334226 100 ug
EUR 241.5

Genomic DNA Kit

abx098076-100l 100 µl
EUR 300

Genomic DNA Kit

abx098076-1ml 1 ml Ask for price

Genomic DNA Kit

abx098076-200l 200 µl
EUR 550

Genomic DNA Kit

20-abx098076
  • Ask for price
  • Ask for price
  • 50 rxns
  • 200 rxns

GENOMIC DNA KIT

IB47250 2 X 96 PREP KIT
EUR 759.68

GENOMIC DNA KIT

IB47251 4 X 96 PREP KIT
EUR 1464.04

GENOMIC DNA KIT

IB47252 10 X 96 PREP KIT
EUR 3254.61

Cat Genomic DNA

GC-130 0.1mg
EUR 177

ELK Genomic DNA

GE-240 0.1mg
EUR 177

Fig Genomic DNA

PLG-1042 0.1mg
EUR 307

Oat Genomic DNA

PLG-1096 0.1mg
EUR 307

Rye Genomic DNA

PLG-1097 0.1mg
EUR 307

Pea Genomic DNA

PLG-1141 0.1mg
EUR 307

Crab Genomic DNA

GRA-340 0.025mg
EUR 177

Clam Genomic DNA

GCL-325 0.025mg
EUR 177

Duck Genomic DNA

GD-220 0.1mg
EUR 177

Goat Genomic DNA

GG-150 0.1mg
EUR 177

Corn Genomic DNA

PLG-1002 0.1mg
EUR 307

Rice Genomic DNA

PLG-1004 0.1mg
EUR 307

Pear Genomic DNA

PLG-1033 0.1mg
EUR 307

Pork Genomic DNA

PCR-705 20µg
EUR 68.12

Human Genomic DNA

BIO-35025 500µl @ 200ng/µl Ask for price

Camel Genomic DNA

GC-270 0.1mg
EUR 177

Quail Genomic DNA

GQ-200 0.1mg
EUR 177

Llama genomic DNA

GL-260 0.1mg
EUR 177

Yeast Genomic DNA*

GY-300 0.05mg
EUR 177

Squid Genomic DNA

GSQ-380 0.025mg
EUR 177

Ecoli Genomic DNA*

GE-310 0.05mg
EUR 177

Goose Genomic DNA

GG-140 0.1mg
EUR 177

Apple Genomic DNA

PLG-1001 0.1mg
EUR 307

Beans Genomic DNA

PLG-1051 0.1mg
EUR 307

Lemon Genomic DNA

PLG-1062 0.1mg
EUR 307

Wheat Genomic DNA

PLG-1084 0.1mg
EUR 307

Onion Genomic DNA

PLG-1092 0.1mg
EUR 307

Maple Genomic DNA

PLG-1094 0.1mg
EUR 307

Lotus Genomic DNA

PLG-1161 0.1mg
EUR 307

Human Genomic DNA

PCR-261 20µg
EUR 72.58

Horse Genomic DNA

PCR-706 20µg
EUR 68.12

Human Genomic DNA 

X11000
  • Ask for price
  • Ask for price
  • 0.2 ml
  • 0.2 ml

Alpaca Genomic DNA

GAP-260 0.1mg
EUR 177

Oyster Genomic DNA

GOY-330 0.025mg
EUR 177

Pigeon Genomic DNA

GP-210 0.1mg
EUR 177

Turkey Genomic DNA

GT-150 0.1mg
EUR 177

Donkey Genomic DNA

GD-160 0.1mg
EUR 177

Ferret Genomic DNA*

GF-180 0.05mg
EUR 177

Gerbil Genomic DNA*

GG-120 0.05mg
EUR 177

Shirmp Genomic DNA

GHR-375 0.025mg
EUR 177

Orange Genomic DNA

PLG-1003 0.1mg
EUR 307

Cotton Genomic DNA

PLG-1022 0.1mg
EUR 307

Banana Genomic DNA

PLG-1031 0.1mg
EUR 307

Barley Genomic DNA

PLG-1041 0.1mg
EUR 307

Pepper Genomic DNA

PLG-1043 0.1mg
EUR 307

Potato Genomic DNA

PLG-1073 0.1mg
EUR 307

Tomato Genomic DNA

PLG-1074 0.1mg
EUR 307

Carrot Genomic DNA

PLG-1081 0.1mg
EUR 307

Radish Genomic DNA

PLG-1083 0.1mg
EUR 307

Cherry Genomic DNA

PLG-1091 0.1mg
EUR 307

Squash Genomic DNA

PLG-1111 0.1mg
EUR 307

Lentil Genomic DNA

PLG-1151 0.1mg
EUR 307

Ostrich Genomic DNA

GO-320 0.1mg
EUR 177

Lobster Genomic DNA

GLB-370 0.025mg
EUR 177

Mussels Genomic DNA

GMU-345 0.025mg
EUR 177

Catfish Genomic DNA

GFC-190 0.025mg
EUR 177

Apricot Genomic DNA

PLG-1011 0.1mg
EUR 307

Soybean Genomic DNA

PLG-1044 0.1mg
EUR 307

Spinach Genomic DNA

PLG-1054 0.1mg
EUR 307

Cabbage Genomic DNA

PLG-1071 0.1mg
EUR 307

Lettuce Genomic DNA

PLG-1072 0.1mg
EUR 307

Ginseng Genomic DNA

PLG-1088 0.05mg
EUR 307

Tobacco Genomic DNA

PLG-1101 0.1mg
EUR 307

Starfish Genomic DNA

GSF-390 0.025mg
EUR 177

Wildboar Genomic DNA

GW-250 0.1mg
EUR 177

Crawfish Genomic DNA

GCF-405 0.025mg
EUR 177

Silkworm Genomic DNA*

GK-390 0.025mg
EUR 177

Cucumber Genomic DNA

PLG-1032 0.1mg
EUR 307

Broccoli Genomic DNA

PLG-1061 0.1mg
EUR 307

Rapeseed Genomic DNA

PLG-1093 0.1mg
EUR 307

Flaxseed Genomic DNA

PLG-1095 0.1mg
EUR 307

Chickpea Genomic DNA

PLG-1121 0.1mg
EUR 307

Alligator Genomic DNA

GL-100 0.025mg
EUR 177

Zebrafish Genomic DNA

GZ-270 0.025mg
EUR 177

Jellyfish Genomic DNA

GJF-365 0.025mg
EUR 177

Persimmon Genomic DNA

PLG-1053 0.1mg
EUR 307

Sunflower Genomic DNA

PLG-1064 0.1mg
EUR 307

Blood samples from wholesome people, in addition to lung most cancers sufferers have been analyzed. We in contrast totally different strategies and protocols for pattern assortment, storage, centrifugation, isolation, and quantification. Cell-free DNA (cfDNA) concentrations of a number of wild-type targets and BRAF and EGFR-mutant ctDNA concentrations quantified by ddPCR have been main final result measurements. Highest cfDNA concentrations have been measured in blood collected in serum tubes.  Highest cfDNA concentrations have been detected after DNA isolation with the Quick cfDNA Serum & Plasma Kit, whereas plasma isolation using the QIAamp Circulating Nucleic Acid Kit yielded probably the most constant outcomes.